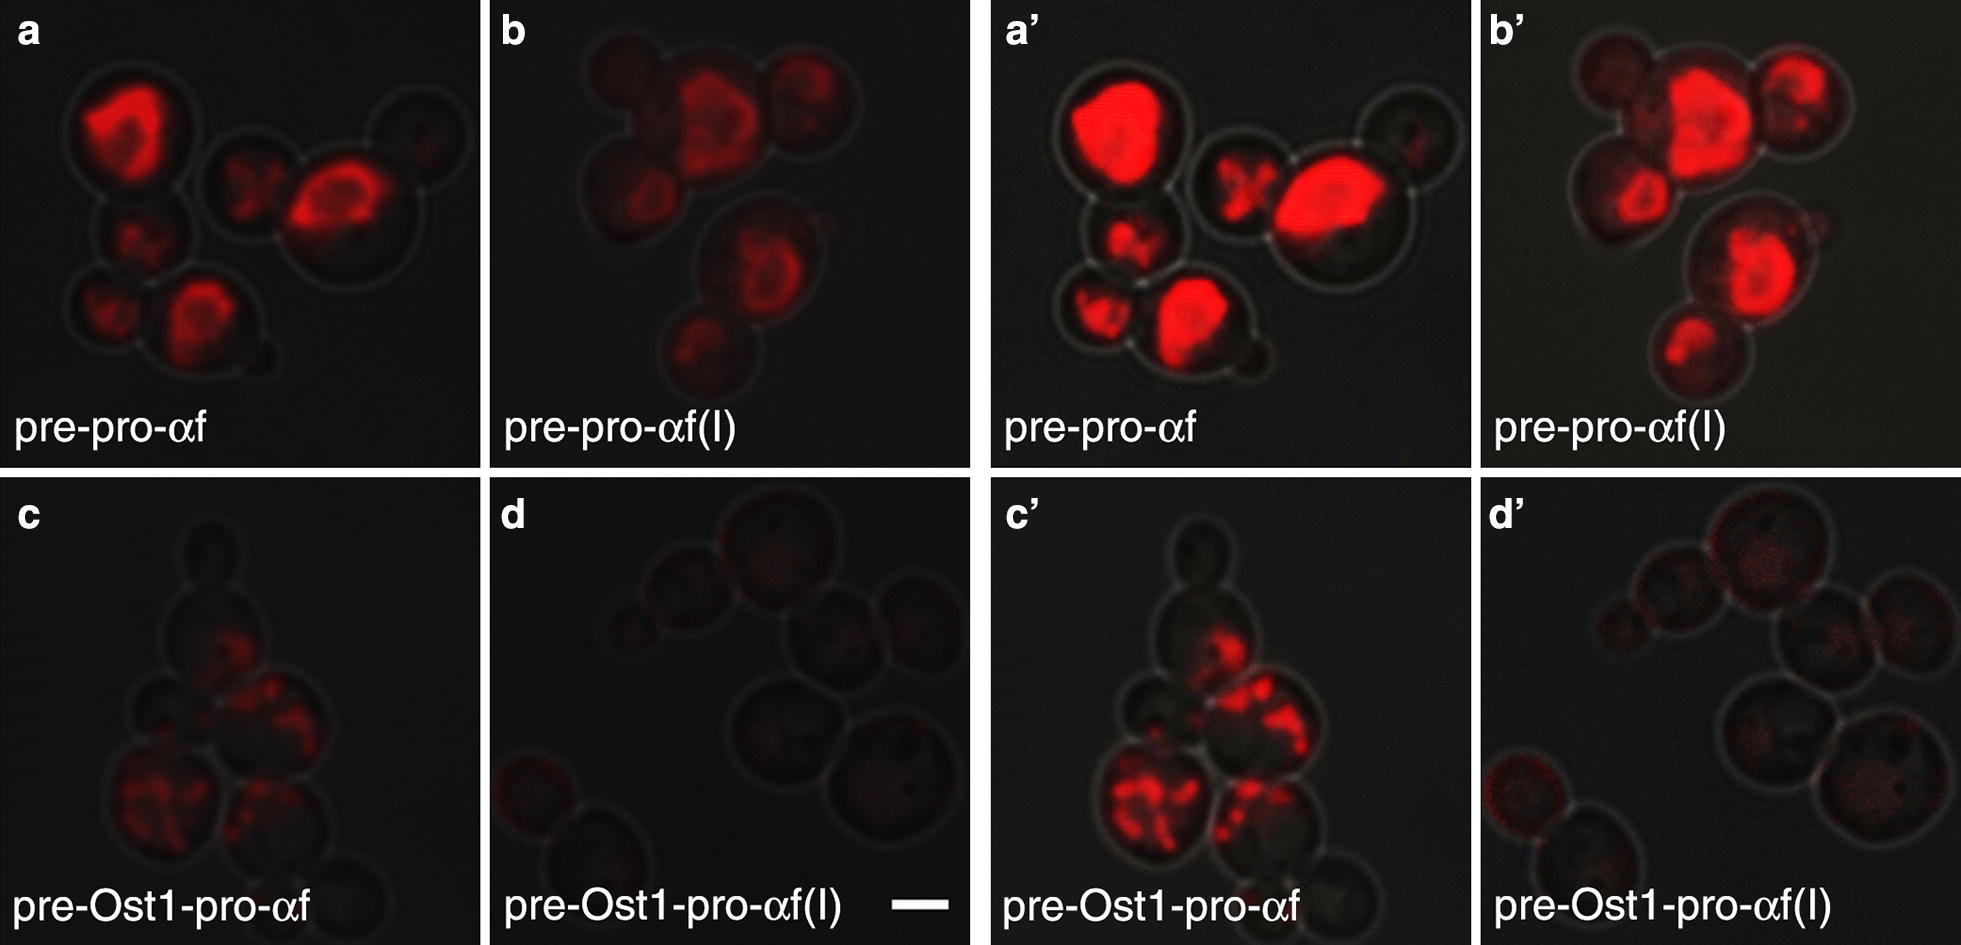
Fig. 3.

Images of intracellular fluorescence with the different secretion signals. The abbreviations are as in Fig. 2. Projected confocal Z-stacks of E2-Crimson fluorescence were merged with differential interference contrast images of the cells. The rings in a, b represent the nuclear envelope, and the spots in c represent aggregates in the ER lumen. a′ through d′ are the same images as a through d but adjusted to a higher brightness level. Scale bar, 2 μm
