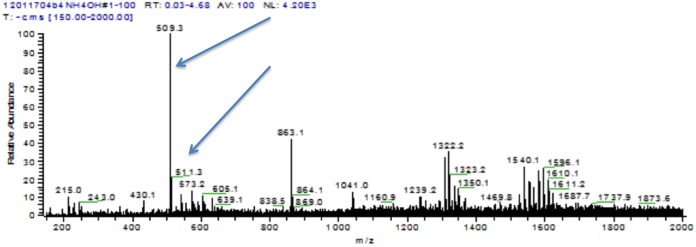
FIG 10.
Negative-ion m/z spectrum of TLC-purified antifungal activity from C3 OMV. A UV-positive band was obtained from a TLC separation of an OMV extract. The extracted band was dissolved in methanol for analysis by electrospray ionization-mass spectroscopy, as shown above. Arrows highlight peaks at m/z 509.3 and 511.3 (discussed in text). The peak at m/z 863.1 is an artifact that also appears in pure solvent spectra.

