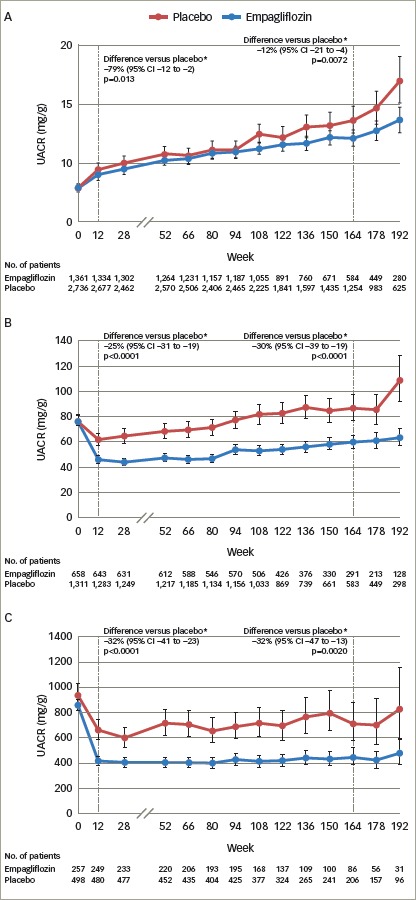
Figure 3: Urinary albumin-to-creatinine ratio over time with empagliflozin versus placebo in patients with normoalbuminuria (A), microalbuminuria (B) and macroalbuminuria (C) at baseline in the EMPA-REG OUTCOME study.

Adjusted mean values and 95% CIs are shown. Mixed model repeated measures analysis using all data obtained until study end in patients treated with at least one dose of study drug. Normoalbuminuria: UACR <30 mg/g. Microalbuminuria: UACR ≥30 to 300 mg/g. Macroalbuminura: UACR >300 mg/g. *placebo-corrected adjusted geometric mean ration (95% CI) of relative change from baseline with empagliflozin. 164 week (IQR 115–186) corresponds to the median observation period. Reproduced with permission from Cherney et al., 2017.44 CI = confidence interval; EMPA-REG OUTCOME = empagliflozin, cardiovascular outcomes, and mortality in type 2 diabetes study; IQR = interquartile range; No. = number; UACR = urine albumin-creatinine ratio.
