
Figure 1: Scenario analysis results, showing ICERs in SEK/QALY.
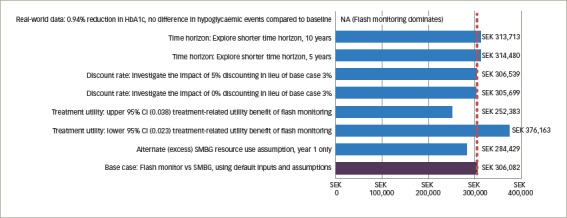
CI = confidence Interval; HbAlc = glycated haemoglobin; ICER = Incremental cost-effectiveness ratio; QALY = quality-adjusted life year; SMBG = self-monltorlng of blood glucose.
Official websites use .gov
A
.gov website belongs to an official
government organization in the United States.
Secure .gov websites use HTTPS
A lock (
) or https:// means you've safely
connected to the .gov website. Share sensitive
information only on official, secure websites.
CI = confidence Interval; HbAlc = glycated haemoglobin; ICER = Incremental cost-effectiveness ratio; QALY = quality-adjusted life year; SMBG = self-monltorlng of blood glucose.