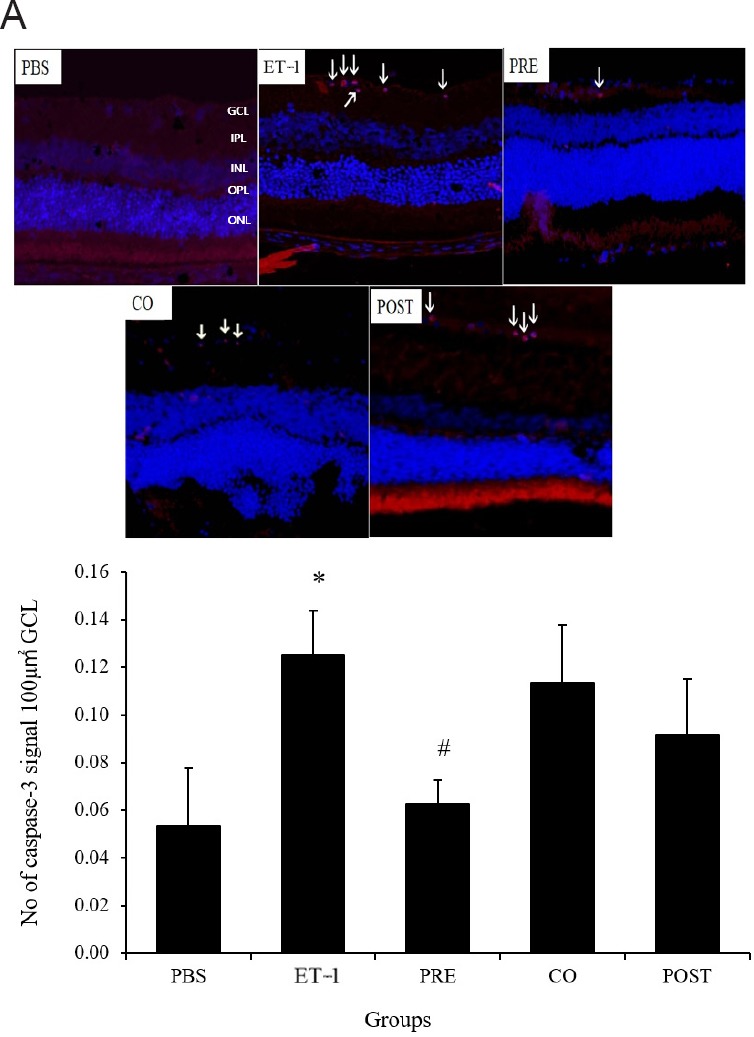
Figure 5.

Effect of TAU on ET-1-induced retinal cell apoptosis as estimated by caspase-3 immunostaining.
(A) Representative retinal sections with caspase 3 staining showing apoptotic retinal cells as indicated by red fluorescent spots (arrows) in retinal sections; counterstaining with DAPI is seen in blue (original magnification, 60×). The PBS group showed no caspase positive cells, while in ET-1 group numerous caspase positive cells were observed. Among TAU treated groups, the PRE group showed minimal number of caspase positive cells, while in the CO and POST groups relatively greater number of caspase positive cells were observed (B). Quantitative estimation of caspase 3 positive retinal cells showed significantly greater number of caspase positive cells in the ET-1 group compared to the PBS group. In the PRE group number of caspase positive cells was significantly lower than the ET-1 group whereas the same in the CO and POST groups did not show significant difference either from the ET-1 or PBS group. Groups - PBS: Phosphate-buffered saline; ET-1: endothelin-1; PRE: pre-treatment with TAU 24 hours before ET-1; CO: co-administration of TAU and ET-1; POST: post-treatment with TAU 24 hours after ET-1. All values are the mean ± SD (n = 6), *P < 0.05, vs. PBS group; #P < 0.05, vs. ET-1 group (one-way analysis of variance followed by Tukey's post-hoc analysis). TAU: Amino acid taurine; GCL: ganglion cell layer.
