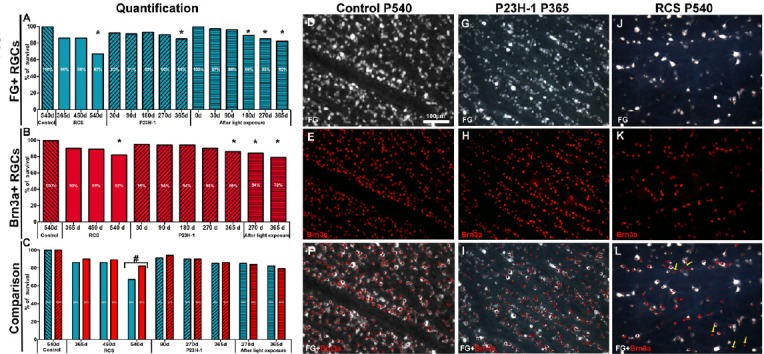
Figure 1.

Retinal ganglion cell (RGC) loss in three models of photoreceptor degeneration.
Percentages of fluorogold (FG)+ RGCs (A), Brn3a+ RGCs (B) and comparison of both (C) at different postnatal days (P) for Royal College of Surgeons (RCS) and P23H rats or days after light exposure. These percentages were calculated considering 100% the number of RGCs in control retinas. *P < 0.05, vs. the earlier time points; #P < 0.05. (D–F) Microphotographs from a representative P540 control rat retina showing FG+ RGCs (D) and Brn3a+ RGCs (E); (F) is a merged image of D and E. (G–I) Microphotographs from a representative P365 P23H-1 rat retina showing FG+ RGCs (G) and Brn3a+ RGCs (H); (I) is a merged image of G and H. (J–L) Microphotographs from a representative P540 RCS rat retina showing FG+ RGCs (J) and Brn3a+ RGCs (K); (L) is a merged image of J and K and shows Brn3a+ RGCs that were not labelled with FG (arrows). FG was applied into both superior colliculi 7 days before animal processing. Scale bar: 100 μm. Data in Figure 1 are from García-Ayuso et al. (2010, 2011, 2014).
