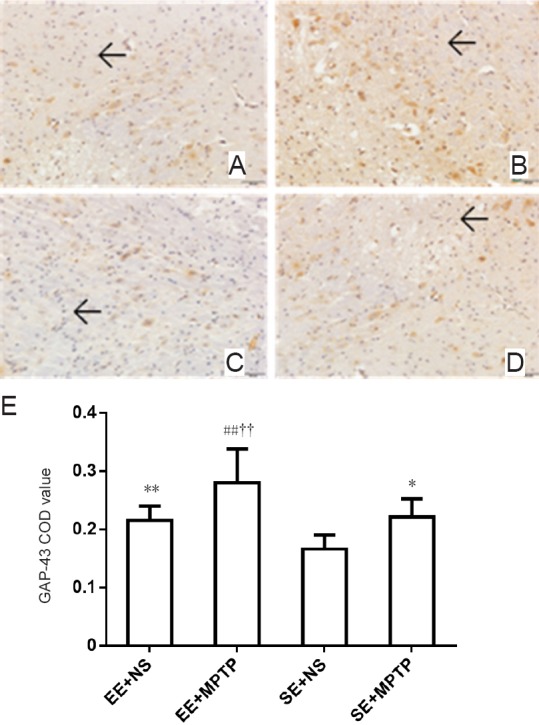
Figure 4.

Effects of EE and MPTP on GAP-43-ir in the substantia nigra of SAMP8 mice.
(A–D) GAP-43-ir in the substantia nigra (original magnification, 200×). (A) EE + NS group, (B) EE + MPTP group, (C) SE + NS group, (D) SE + MPTP group. GAP-43-ir was intense in the EE + NS group compared with the SE + NS group. GAP-43-ir was higher in the EE + MPTP group compared with the SE + MPTP group. GAP-43-ir was higher in the EE + MPTP group than in the EE + NS group and GAP-43-ir was greater in the SE + MPTP group than in the SE + NS group. Arrows indicate GAP-43-ir. Scale bar: 50 µm. (E) Quantitation of GAP-43-ir. Data are expressed as the mean ± SD (one-way analysis of variance followed by the least significant difference test). **P < 0.01, vs. SE + NS group; ##P < 0.01, vs. EE + NS group; ††P < 0.01, vs. SE + MPTP group. COD: Corrected optical density; EE: enriched environment; SE: standard environment; MPTP: 1-methyl-4-phenyl-1,2,3,6-tetrahydropyridine; NS: normal saline; SAMP8: senescence-accelerated mouse prone 8; GAP-43-ir: growth associated protein-43 immunoreactivity.
