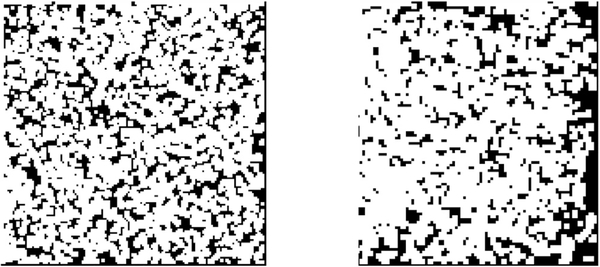
Fig. 15.
Selection of τ2 for a β-galactosidase sample micrograph (left) and a 70S ribosome sample micrograph (right). The white regions contain the 50% of query images with the highest k(sg). The black regions are the regions from which the training windows of noise are extracted. We note that while the β-galactosidase sample will have plenty of training windows for noise, the 70S ribosome sample will not.

