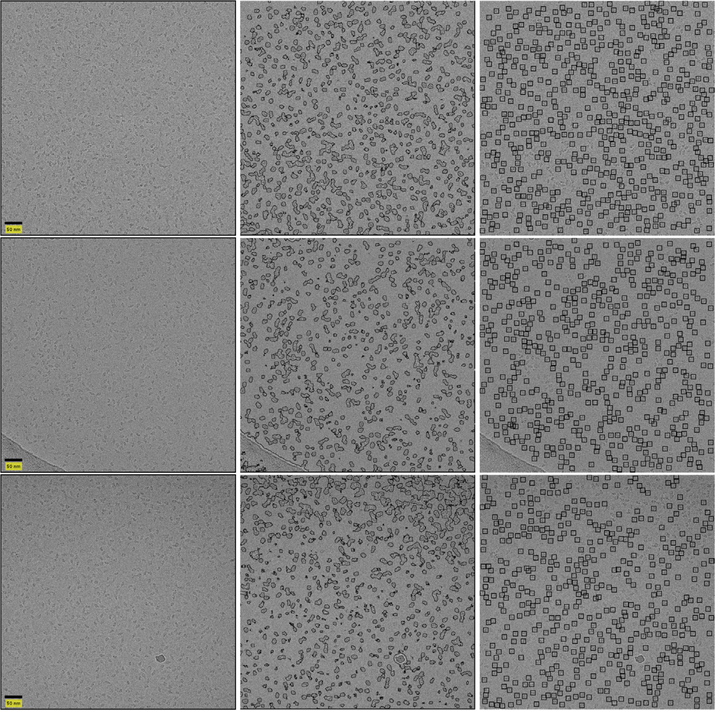
Fig. 7.
Picked particles of sample β-galactosidase micrographs (without CTF correction). The micrographs are presented in the left column. Classification results are presented in the center. The picked particles are on the right. Defocus values are 4191.1, 4859.1 and 4224.8 nm for the top, middle and bottom micrographs, respectively. All defocus values were calculated with ctffind4 from the RELION wrapper.

