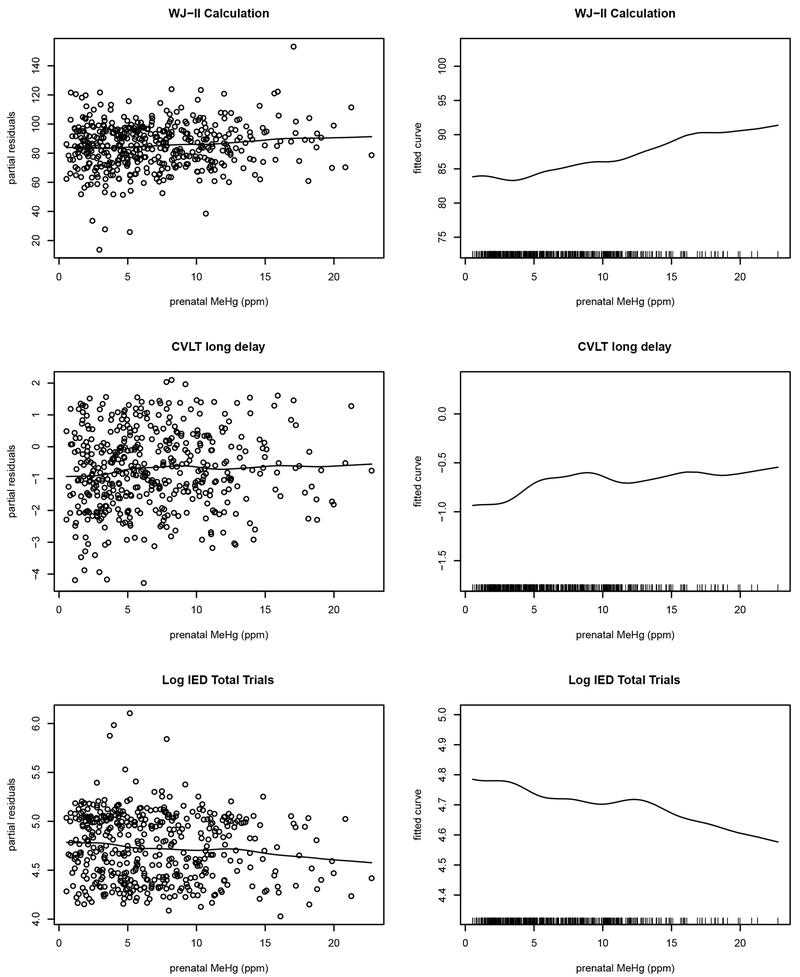
Figure 1.
The curve of the fitted smooth function with 3 degrees of freedom for prenatal MeHg effects to the additive predictor for WJ-II Calculation subtest, CVLT—Long Delay subtest, and log CANTAB IED test total trials. This analysis is unrelated to regression trees and assumes homogeneous MeHg-outcome relationships and a linear structure for covariates and postnatal MeHg effects. The left panel shows the partial residual plots and the smoothed curves of the prenatal MeHg association. The same curves are shown in the right panel again without residuals on a magnified scale to clearly view the oscillating trends with the vertical marks along the bottom illustrating the distribution of prenatal MeHg levels. An increase in the score is associated with improved performance on the WJ-II Calculation and CVLT—Long Delay subtests, while for the log CANTAB IED test total trials decreased scores mean improved performance,

