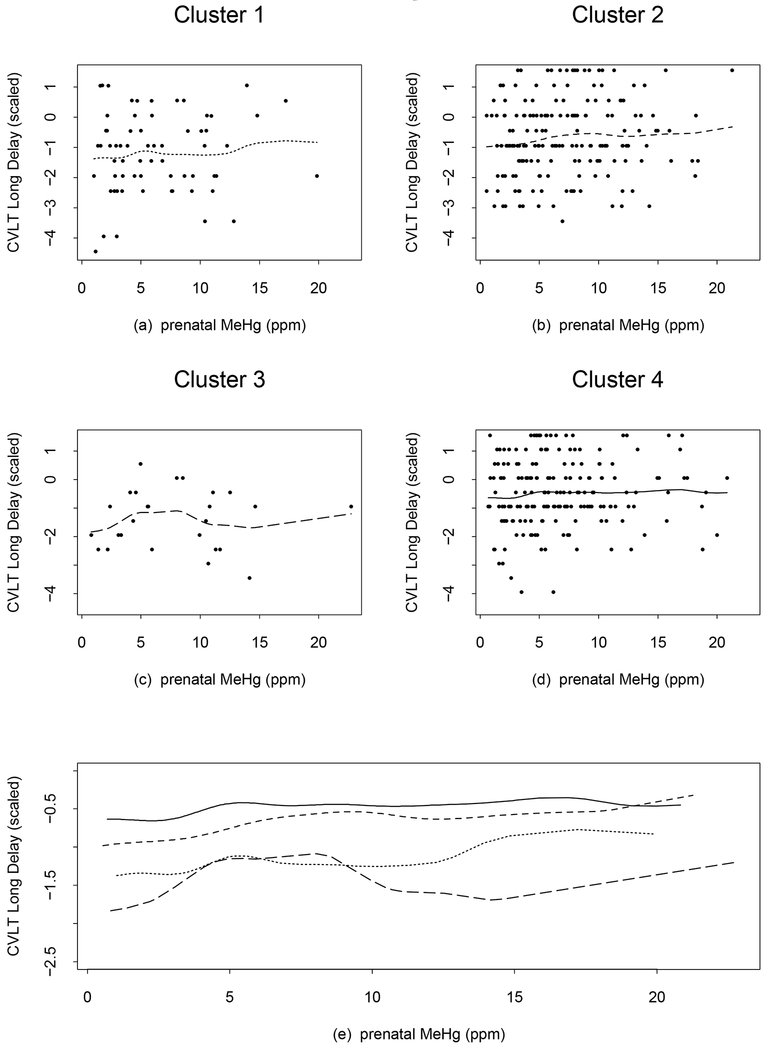
Figure 3.
CVLT—Long Delay subtest plots from the additive model with 3 degrees of freedom each for the smoothed terms of prenatal MeHg exposure, adjusted for cluster effects from the regression tree. Points show the observed values and lines show predicted values from the model, (a) dotted line (cluster 1), (b) short dash line (cluster 2), (c) long dash line (cluster 3), and (d) solid line (cluster 4). The line types are chosen to be in an increasing order (dotted, short dash, long dash, and solid) as the cluster index increases from 1 to 4. Panel (e) shows all 4 curves simultaneously and the line types correspond to those in (a)-(d). An increase in the CVLT—Long Delay score is associated with improved performance.

