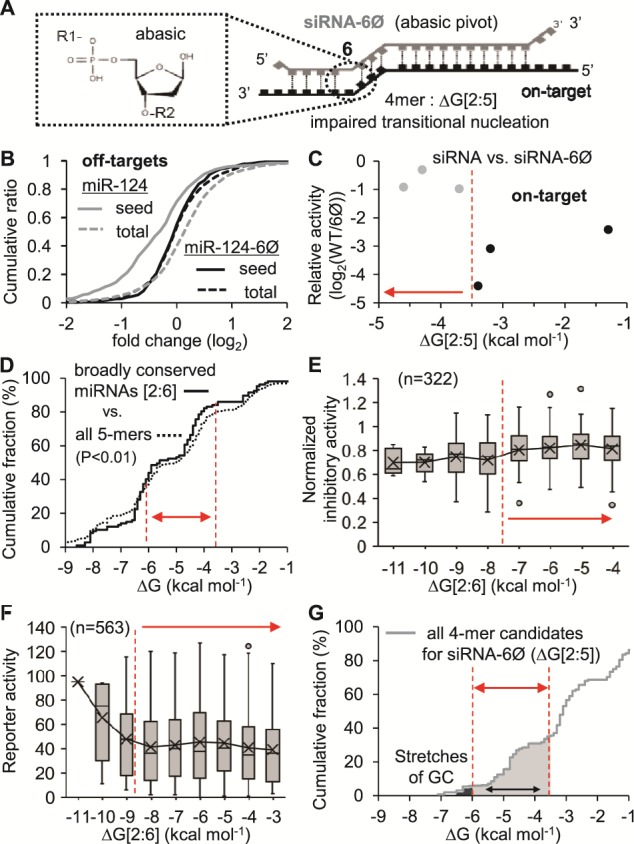
Figure 2.

The range of transitional nucleation required to induce potent on-target activity of siRNA. (A) The functional interaction of siRNA-6Ø with on-target mRNA. Notably, siRNA-6Ø has impaired transitional nucleation (ΔG[2:5]) by harboring abasic pivot but possibly compensated by near-perfect matches in the rest of regions. (B) The cumulative fraction of fold changes (log2) showed that miRNA-dependent transcripts with high-confidence seed target sites (seed) were significantly downregulated by miR-124 (P < 0.01) but completely derepressed by miR-124-6Ø (P = 0.54, seed vs. total, KS test). (C) On-target activity of siRNA-6Ø relative to the unmodified siRNA (WT), experimentally derived from six siRNAs (log2(IC50[WT]/IC50[6Ø]). Conserved (gray dots) and non-conserved siRNAs (black dots) are indicated. (D) Free energies from transitional nucleation (ΔG[2:6]) of broadly conserved miRNAs (n = 107) are compared with those of all 5-mers by cumulative fraction analysis, showing significant differences (P < 0.01, KS test). Distribution of results comprising the cumulative fraction is represented in Supplementary Figure S4A–B. (E) High-confidence siRNAs and their reported normalized inhibitory activities from siRNA experiments (n = 322, Supplementary Table S4) within the displayed range of free energy in this figure were plotted against the free energy of transitional nucleation. (F) The same analysis conducted in (E) except for compiled siRNA sequences (n = 563) from 15 different siRNA studies and y-axis with reporter activity, which is negatively correlated with normalized inhibitory activity in general. (G) All 4-mer candidates for the impaired transitional nucleation region (position 2–5) of siRNA-6Ø were plotted as analyzed in (D). The appropriate free energy range (solid light gray area) and the cutoff value (−6 ≤ ΔG[2:5] ≤ −3.5 kcal mol−1) are indicated. Determined range of transitional nucleation was indicated with red dotted line and solid double arrow. Red dotted line and solid arrow denote the determined cutoff. Distribution of results comprising the cumulative fraction is represented in Supplementary Figure S4C.
