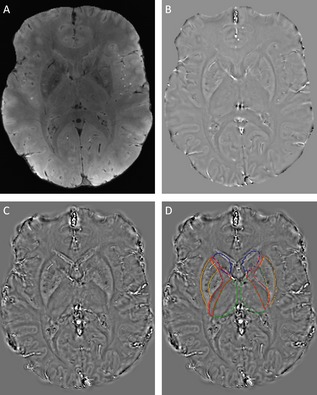
Figure 1.

Output of image‐processing steps. (A) Magnitude image, (B) unwrapped filtered phase image, (C) susceptibility map calculated by thresholded k‐space division with single‐orientation acquisition, and (D) susceptibility map with ROIs highlighted in color: blue, caudate nucleus; orange, putamen; dark green, globus pallidus; red, internal capsule; green, thalamus.
