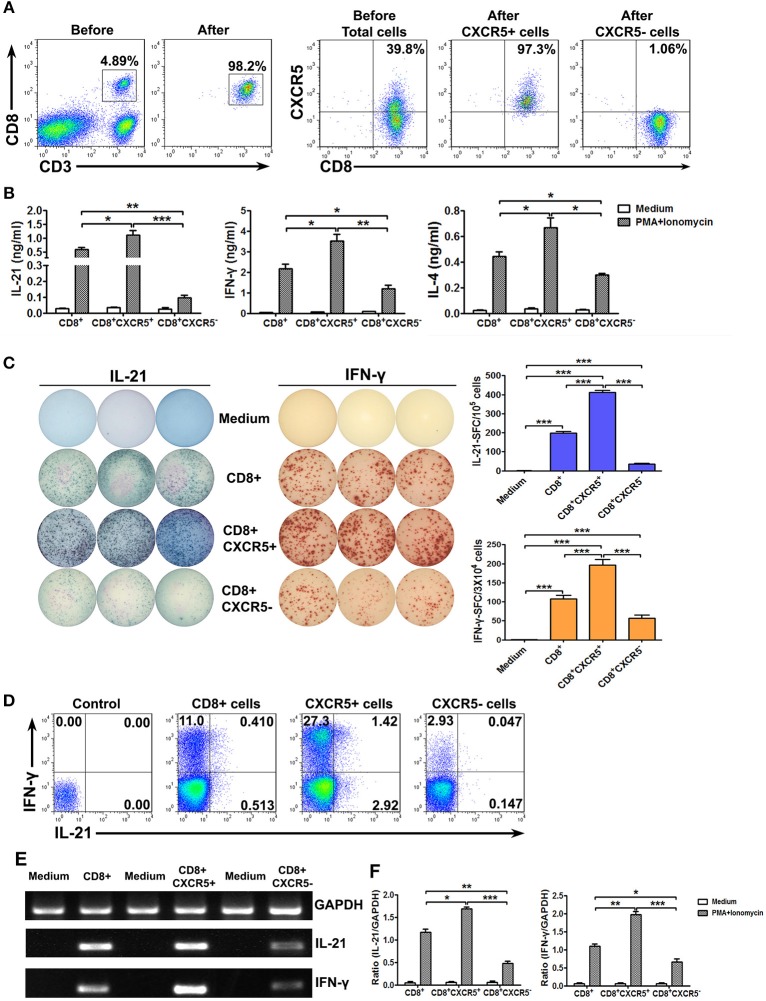
Figure 4.
Sorted CXCR5+ CD8+ T cells expressed higher levels of cytokines at protein and mRNA levels than CXCR5− CD8+ T cells. Tonsil CD8+ T cells were isolated using the appropriate microbeads, and the purity of the cells was ≥98%. CXCR5+ CD8+ and CXCR5− CD8+ T cells from tonsil CD8+ T cells were further sorted by flow cytometry (A). Purified CD8+, sorted CXCR5+ CD8+ and CXCR5− CD8+ T cells were stimulated with PMA and ionomycin. The supernatants from the cultures were analyzed by ELISA for the production of IL-21, IFN-γ, and IL-4 (B). The frequency of IL-21 and IFN-γ-producing cells was assessed by ELISPOT. The left panel shows representative counting of spot-forming cells (SFC) and the right panel shows the frequency of IL-21 and IFN-γ-producing cells as the mean with individual data points (C). FACS analysis of IL-21, and IFN-γ expression in CD8+, CXCR5+CD8+, CXCR5−CD8+ T cells (D). The levels of IL-21, IFN-γ and GAPDH mRNA in CD8+, CXCR5+CD8+, CXCR5−CD8+ T cells were determined by PCR (E), and the ratio of IL-21 or IFN-γ to GAPDH were quantified by densitometry (F). Statistical significance was compared with Mann–Whitney test. *P < 0.05; **P < 0.01; ***P < 0.001.

