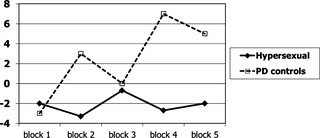
Figure 1.

Performance on the IGT. “Hypersexual” PD patients with hypersexual behavior (n = 6; solid line) and PD controls (n = 11; broken line). Y‐axis shows mean net score from advantageous decks (C and D) minus disadvantageous decks (A and B) over the course of five blocks (each block represents 20 consecutive card selections). HS patients show significantly poorer learning.
