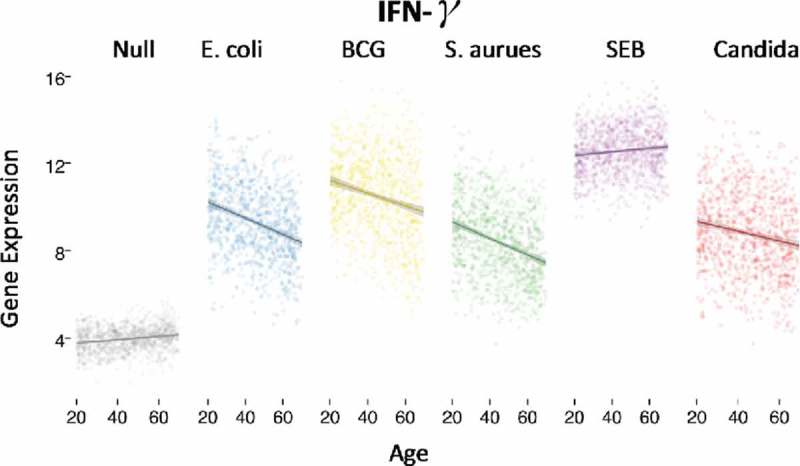
Figure 2.

Age specific decline of IFNγ gene expression following stimulation with E. coli, BCG, S. aurues, and C. albicans, but not SEB. Each dot represents an individual of the 1,000 donor MI cohort as stratified by age, and IFNγ gene expression measured by Nanostring. (Adapted from Piasecka et al, PNAS 201816 using the R Shiny application at http://www.misage.pasteur.fr).
