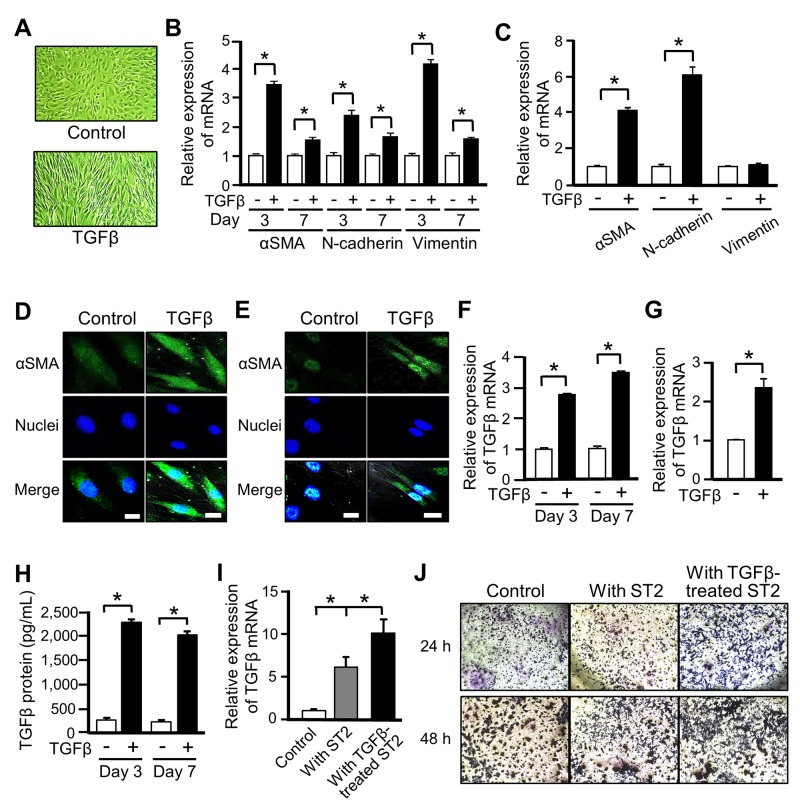
Figure 1. Mesenchymal stem cells (MSCs) differentiate into cancer-associated fibroblasts (CAFs) upon TGFβ stimulation.
(A) Microscopic images of ST2 cells after stimulation with TGFβ (10 ng/mL) for 48 h. Magnification ×100. (B, C) Quantitative RT-PCR analysis was performed to measure mRNA expression of the CAF markers αSMA, N-cadherin, and vimentin in ST2 cells treated with TGFβ for 3 and 7 days (B) and in human MSCs treated with TGFβ for 3 days (C). Each bar represents the mean ± SD (N=3), *P < 0.05. (D, E) Immunostaining of αSMA (green) was performed in ST2 cells (D) and human MSCs (E) treated with TGFβ for 48 h. Each scale bar indicates 20 μm. Nuclei were stained with TO-PRO-3 (blue). (F, G) Quantitative RT-PCR analysis was performed to measure mRNA expression of TGFβ in ST2 cells treated with TGFβ for 3 and 7 days (F) and in human MSCs treated with TGFβ for 3 days (G). Each bar represents the mean ± SD (N=3), *P < 0.05. (H) Secretion of TGFβ by ST2 cells treated with TGFβ for 3 and 7 days was assessed by an ELISA. Each bar represents the mean ± SE (N=3), *P < 0.05. (I) B16 cells were co-cultured with non-treated or TGFβ-treated ST2 cells in a transwell plate for 7 days, and mRNA expression of TGFβ in B16 cells was measured by quantitative RT-PCR analysis. Each bar represents the mean ± SD (N=3), *P < 0.05. (J) B16 cells were co-cultured with non-treated or TGFβ-treated ST2 cells for 24 or 48 h, and invaded B16 cells were stained with crystal violet (deep blue).

