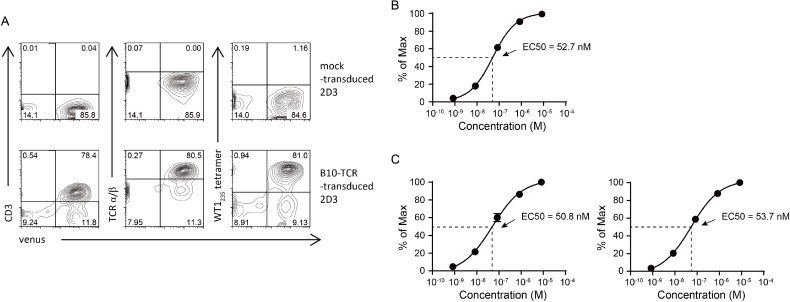
Figure 2. Evaluation of TCR functional avidity by 2D3 cells.
(A) Expression of CD3 and TCR in B10-TCR-transduced 2D3 cells. The 2D3 cells were stained with anti-CD3, anti-TCR α/β mAbs, and WT1235 tetramer. Representative contour plots are shown. (B, C) Peptide concentration-response curves in 2D3 cells transduced with three different B10-TCR constructs. The 2D3 cells were stimulated with titrated concentration of modified WT1235 peptide (mWT1235). Y-axis represents the frequency (% of max) of GFP-positive cells in 2D3 cells. (B) Peptide concentration-response curve of original α-p2A-β B10-TCR-transduced 2D3 cells. (C) Peptide concentration-response curves of codon-optimized α-p2A-β (left) and β-p2A-α (right) B10-TCR-transduced 2D3 cells. All data are mean value ± SEM (n = 3). All data are normalized as a percent of maximal frequency of GFP-positive cells.

