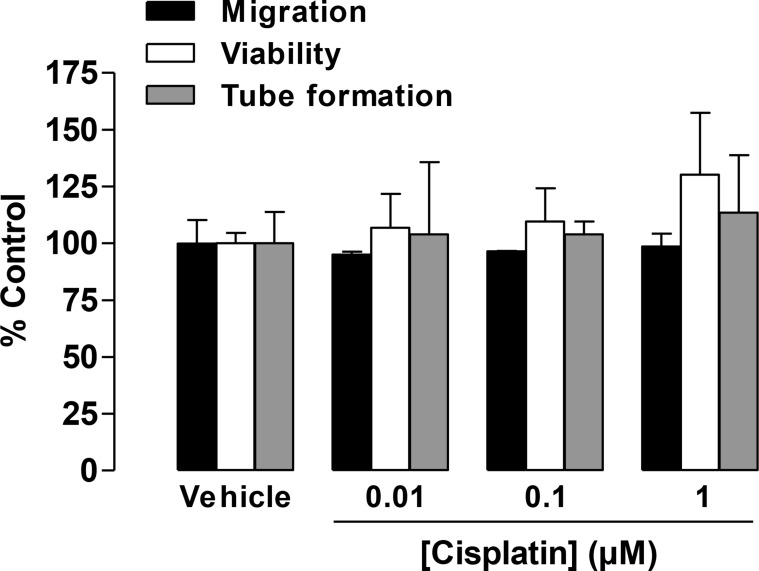
Figure 2. Impact of cisplatin on the migration, viability, and tube formation of HUVECs.
Migration (black bars, modified Boyden chamber assay) and viability (white bars, WST-1 assay) of HUVECs were measured following a 24-h incubation. Tube formation (grey bars) was determined following a 2-h incubation with vehicle or the indicated concentrations of cisplatin. Percentage of control represents comparison with vehicle-treated cells (set as 100%) in the absence of cisplatin. Values are the mean ± SEM of n = 3, respectively. Statistical analyses were performed using one-way ANOVA followed by a post-hoc Dunnett test, but statistical significance was not reached between vehicle- and cisplatin-treated cells.

