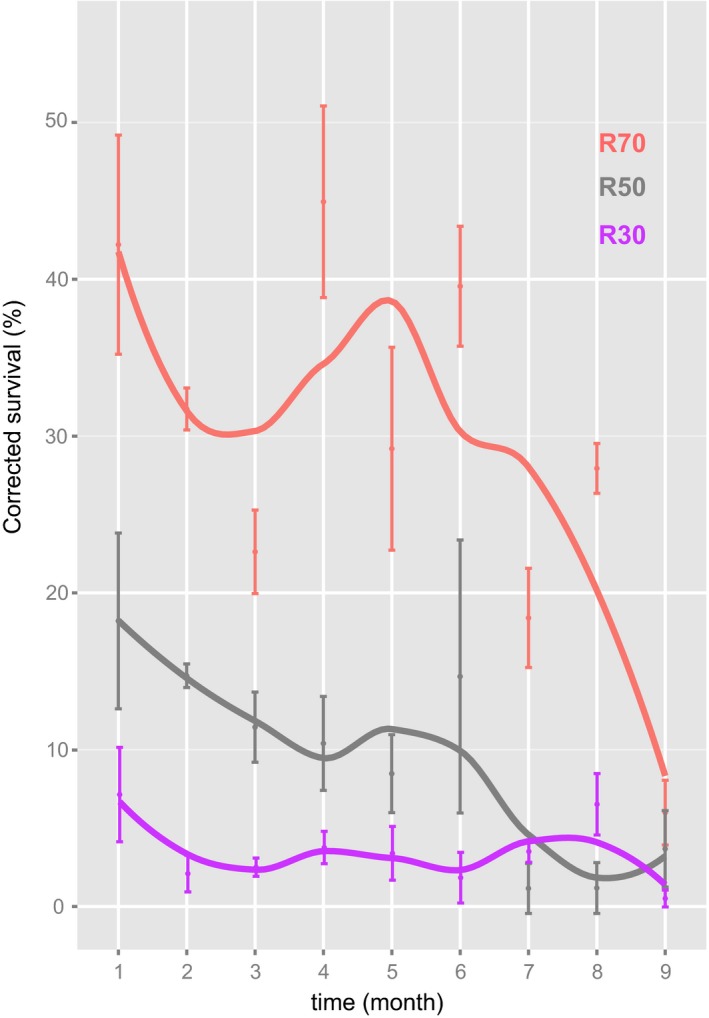
Figure 3.

Visualization of the temporal dynamics of etoxazole resistance in Tetranychus urticae. Nonparametric loess curves were fitted to the data using the lowess function in R. Red color depicts population R70, gray R50 and purple R30, that is, populations with 70%, 50% and 30% of resistant homozygous females in the starting population, respectively
