
Figure 3.
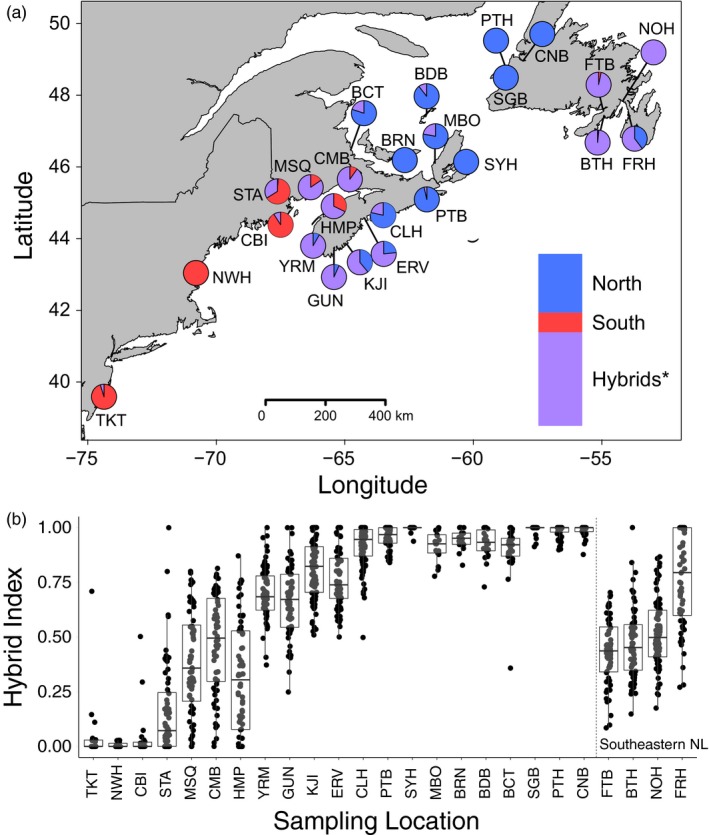
(a) Map of 25 European green crab (Carcinus maenas) sampling locations with the proportion of individuals assigned to pure or hybrid genotype classes by the program NEWHYBRIDS based on 96 informative SNPs. Map shows assignment to two pure (north and south) and a single hybrid class. Inset bar plots show the proportion of individuals assigned to each genotype class across all sites. The asterisk (*) denotes that all hybrids were assigned as recombinant hybrids (i.e., no first‐generation hybrids) using subsequent analyses in NEWHYBRIDS. (b) Boxplot of individual hybrid indices for sampling locations calculated using methods described by Buerkle (2005). Locations are arranged from south to north (Tuckerton, NJ to Corner Brook, NL) with known hybrid locations in southeastern NL shown separately. A hybrid index of 0 represents a pure south individual, whereas a hybrid index of 1 represents a pure north individual. Data points that fall within the upper and lower quartiles of the population are coloured grey, whereas those that fall outside these regions are coloured black