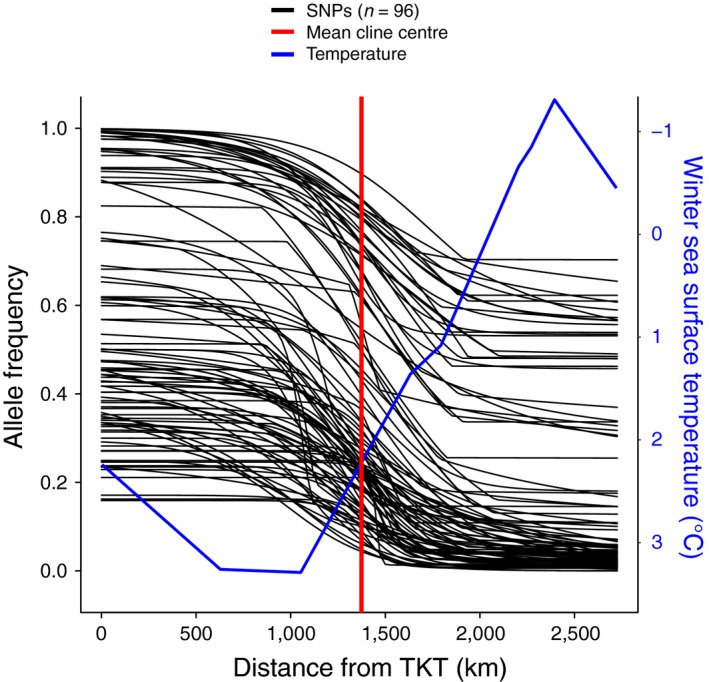
Figure 5.

Maximum‐likelihood (ML) genetic clines for European green crab (Carcinus maenas) for 96 single nucleotide polymorphisms (SNPs) where clines (black lines) were modelled using hzar (Derryberry et al., 2014) with allele frequency against the distance from Tuckerton, New Jersey (TKT) for each site. The mean ML estimate of cline centre is indicated by the red line. Mean winter sea surface temperature (blue line) from 2018Jeffery et al. (2018) was added on an inverse scale on the right‐hand axis for comparison against cline models. Clines for each SNP were weighted based on their effective number of alleles as described in the Section 2
