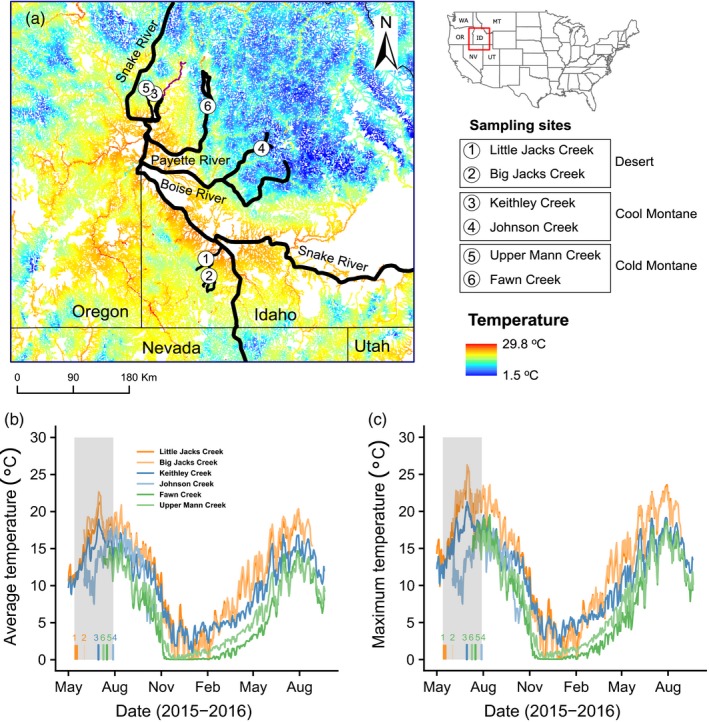
Figure 1.

Location and thermal regime of sampling sites. (a) geographical locations of six sampling sites and modeled mean stream temperature in August (Isaak et al., 2016); (b) average stream temperature (daily); (c) maximum stream temperature (daily). Note that data of Johnson Creek in panel b and c were from 2009. Shaded region in gray represents the range of sampling dates for cardiac phenotypes and genetic tissues, with specific sampling time for each location noted by a colored block
