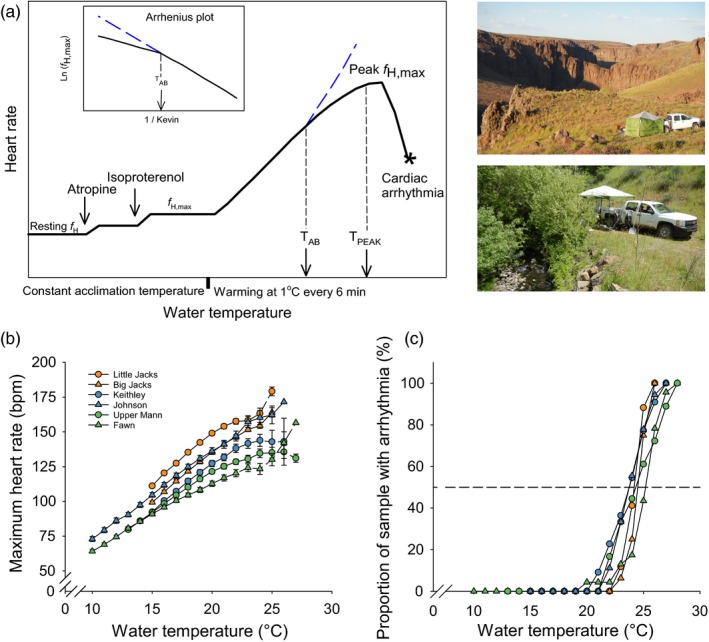
Figure 2.

Intraspecific maximum heart rate (f h,max) during acute warming in six populations of redband trout. (a) Diagram to demonstrate how the cardiac phenotypes were methodologically determined and photographs of the field setup of the electrocardiogram apparatus for cardiac phenotyping. (b) thermal response of f h,max, which were correct to a common mass of 11 g using mass exponent of −0.1. (c) cumulative proportion of samples reaching peak f h,max
