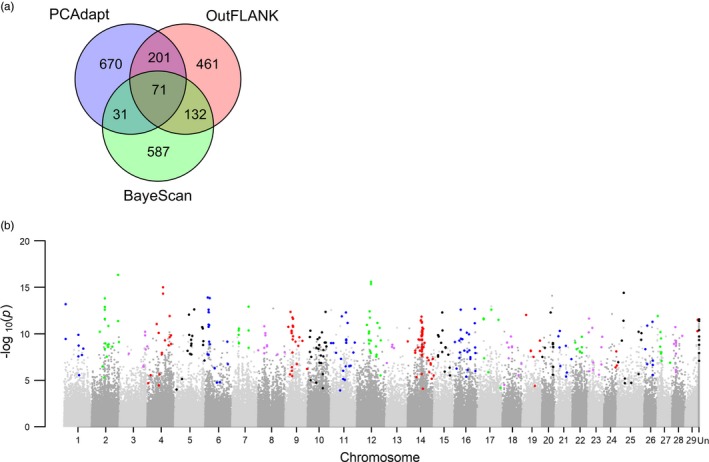
Figure 3.

Outlier loci analyses. (a) number of outlier loci identified by each method. (b) Manhattan plot of combined p‐values, which were derived from the median z‐score of results from OutFLANK and PCAdapt. Only the loci that were identified by at least two methods are noted as outliers (a total of 435). Outlier loci are marked as nongray points in the Manhattan plot. Loci that were not assigned a chromosome position are marked as “Un.” Mapping details and annotation of outlier loci can be found in Supporting information Table S1
