Figure 4.

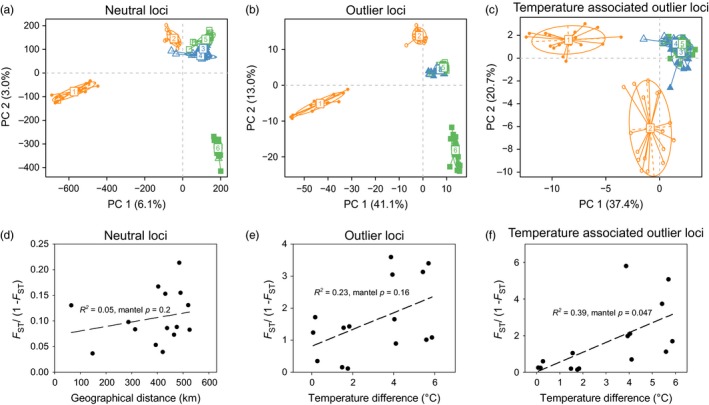
Population structure of six redband trout populations. Principal component analysis demonstrated population structure using 525,866 neutral loci (a), 435 outlier loci (b), and 20 outlier loci that were associated with summer temperature (c). Yellow color points: desert ecotype; blue: cool montane ecotype; green: cold montane ecotype. 1: Little Jacks; 2: Big Jacks; 3: Keithley; 4: Johnson; 5: Upper Mann; 6: Fawn. Panel d shows the pattern of isolation by distance using all neutral loci and fluvial distance among populations. Patterns of isolation by maximum stream temperature in summer (July and August 2015) were analyzed using all outlier loci (e) and outlier loci that are associated with summer temperatures (f)
