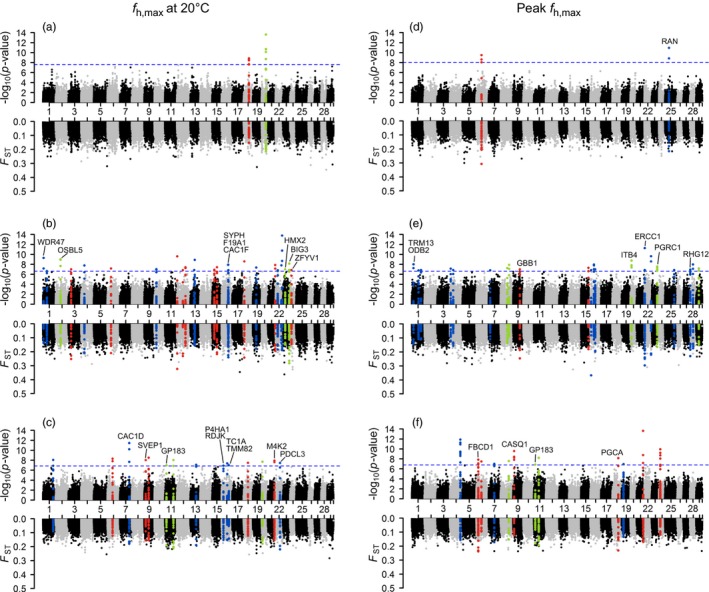
Figure 5.

FST between cardiac phenotype classes at each locus within each ecotype. The x‐axis is the marker position for chromosome number 1–29. Markers that were not assigned a chromosome position are placed as chromosome 30. Phenotypes of f h,max at 20°C (a‐c) and peak f h,max (d‐f) were evenly divided into two classes (low and high) within each ecotype (desert = a and d, cool montane = b and e, cold montane = c and f). FST was calculated for each locus between the two phenotypic classes for a sliding window size of 10 kb (step size 200 bp). Fisher's exact test was used to test the significance for each window. Dashed blue line represents the threshold after BY‐FDR. Color points represent the sliding windows within 50 kb of the significant loci. Mapping details and annotation of significant sliding windows can be found in Supporting information Table S2
