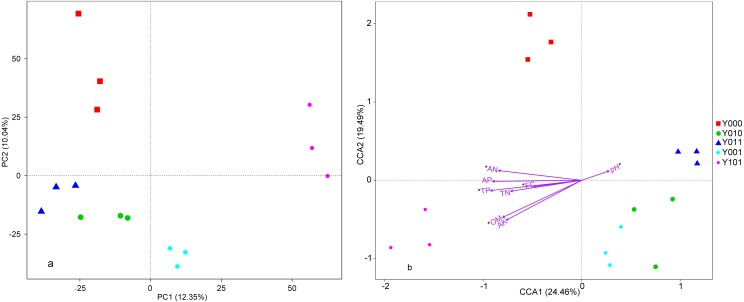
Figure 2. Principal component analysis (PCA) and canonical correspondence analysis (CCA).
(A) PCA based on OTUs of the bacterial community. (B) CCA based on edaphic factors and the bacterial community composition. Different grids are represented by different colours. Spots with the same colour represent the same grids. Edaphic factors are shown as arrows, and the degree of correlation between one edaphic factor and community/species composition is represented by the length of the arrow. Longer arrows indicate higher correlations. The angle constructed by the arrow and the ordination axes indicates the correlation between the edaphic factors and the ordination axes. A smaller angle indicates a higher correlation. FC, field capacity; OM, organic matter; TN, total nitrogen; TP, total phosphorus; AN, alkaline hydrolysable nitrogen; AP, available phosphorus; and AK, available potassium. Available edaphic factors for the bacterial community composition are shown as *, i.e., having a variance inflation factor (VIF) value of less than 20.

