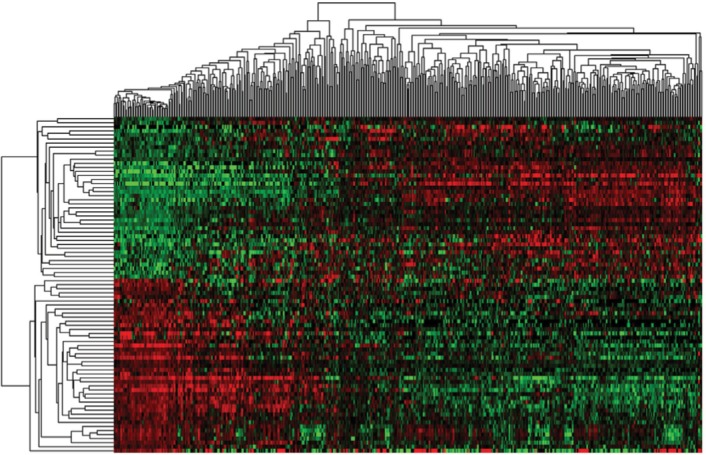
Figure 1.

Cluster analysis of consistent differential lncRNA expression.
Note: Red indicates that the lncRNA has higher expression level; green indicates that the lncRNA has lower expression.

Cluster analysis of consistent differential lncRNA expression.
Note: Red indicates that the lncRNA has higher expression level; green indicates that the lncRNA has lower expression.