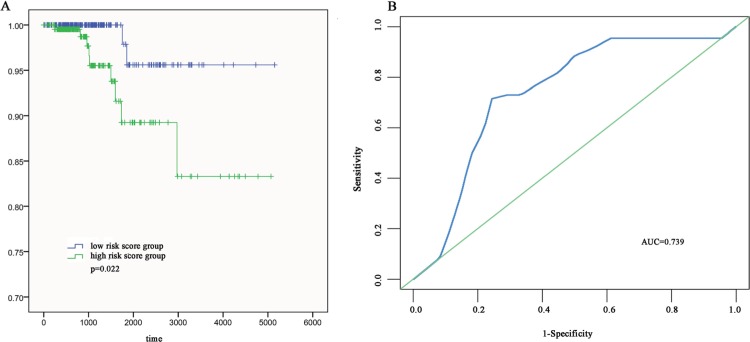
Figure 3.
The three differentially expressed lncRNA signatures of PTC for the outcome.
Notes: (A) The risk score is shown by the time-dependent ROC curve for predicting 5-year survival. (B) The K–M test of the risk score for the OS.
Abbreviations: AUC, area under the curve; K–M, Kaplan–Meier; OS, overall survival; PTC, papillary thyroid carcinoma; ROC, receiver operating characteristic.

