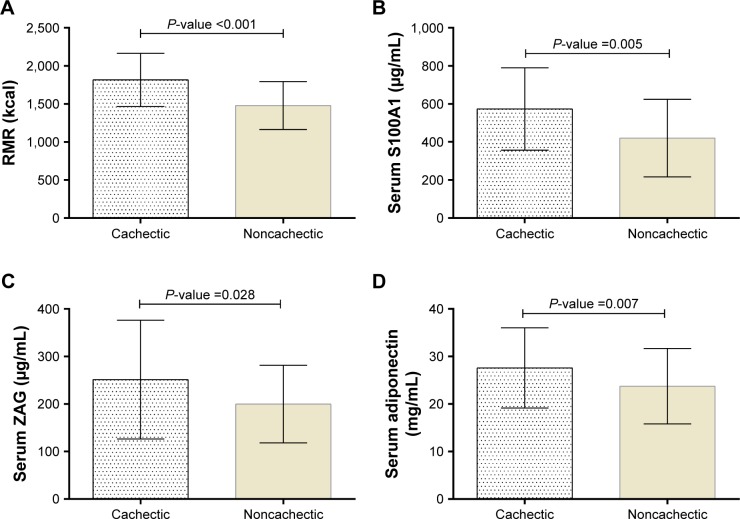
Figure 1.
RMR (A) and serum levels of S100A1 (B), ZAG (C), and adiponectin (D) in cachectic and noncachectic groups.
Notes: Data are presented as mean ± SD. P-values are reported based on ANCOVA after controlling the physical activity and RMR.
Abbreviations: RMR, resting metabolic rate; ZAG, zinc alpha 2-glycoprotein.

