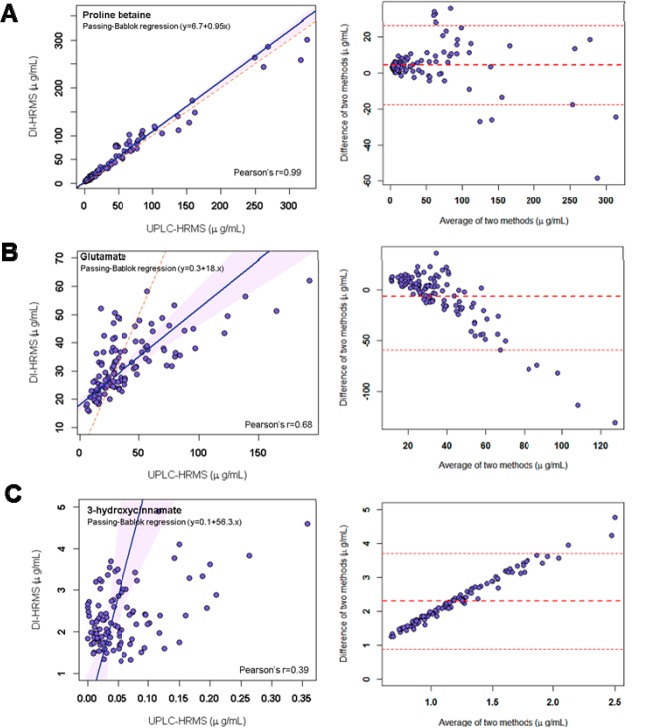
Figure 2.
Passing–Bablok regression with Pearson’s r parameter and agreement (Bland–Altman) plots for selected metabolites measured by UPLC–HRMS and DI–nESI–HRMS showing different levels of correlation: strong correlation (proline betaine); moderate correlation (glutamate) (the results are underestimated in UPLC–HRMS data due to early elution); and weak correlation (3-hydroxycinnamate) due to the overestimation in the DI–nESI–HRMS data.

