Fig. 1.
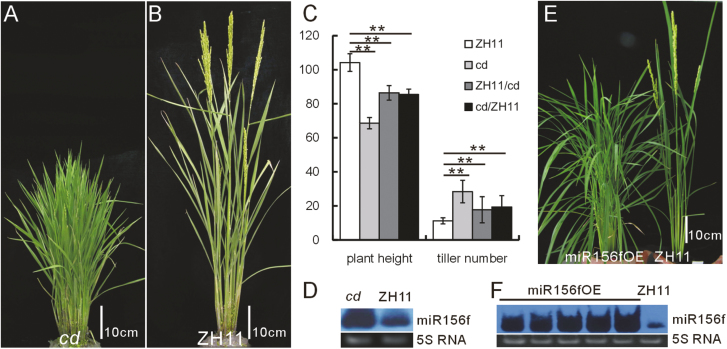
Characterization of the cd mutant phenotype and association of miR156f expression with the cluster and dwarf phenotype. (A and B) Representative cd mutant (A) and WT (B) plants. (C) Plant heights and tiller numbers of the cd mutant, and the crosses between the cd mutant and WT. The asterisks represent a significant difference, as determined by a Student’s t-test at *P<0.05 and **P<0.01, respectively (n=20). (D) miR156f expression in the cd mutant. (E) Phenotype of the miR156fOE transgenic plants (left) as compared with the WT (right). (F) miR156f expression in the miR156fOE lines.

