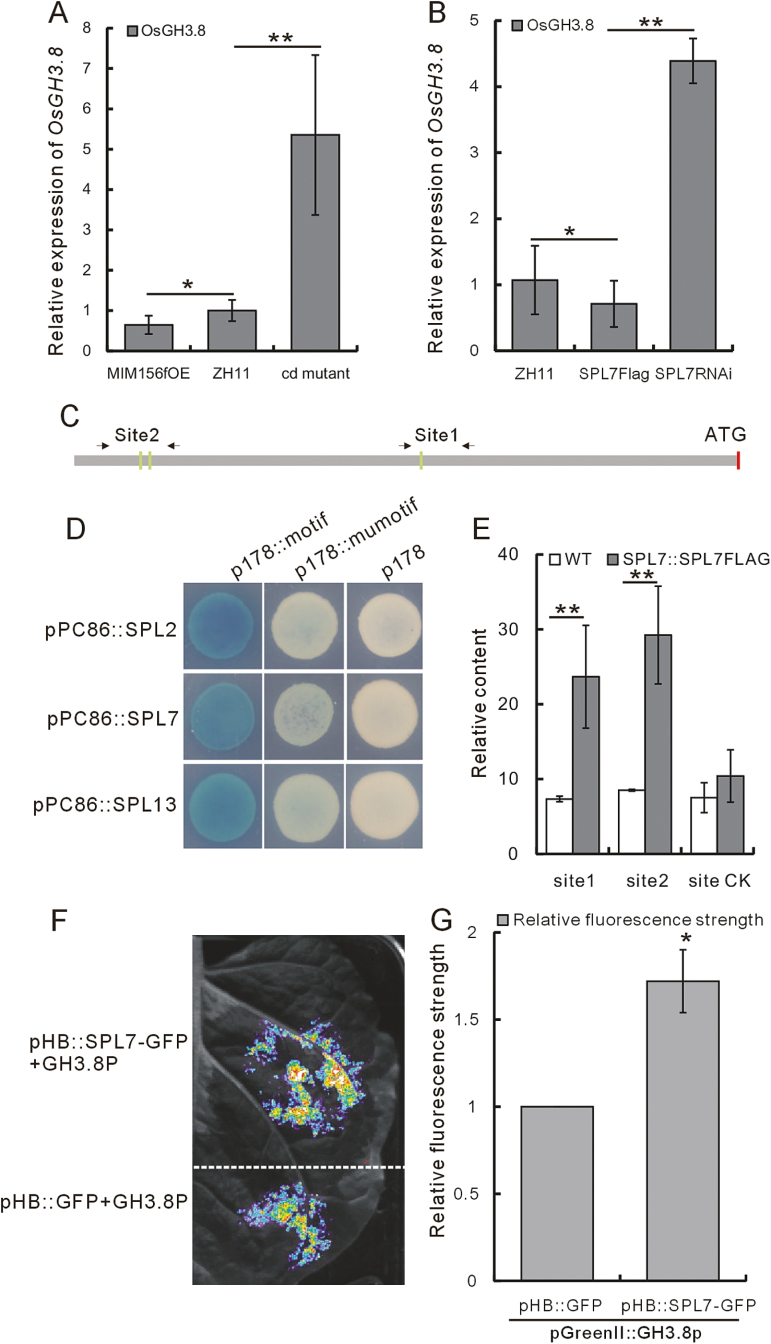
Fig. 5.
Confirmation of the transcriptional regulation of the OsGH3.8 gene by OsSPL7 protein. (A) OsGH3.8 expression in the cd mutant and the MIM156fOE plants (n=3). (B) OsGH3.8 expression in the SPL7Flag and SPL7RNAi plants (n=3). (C) Schematic of the SPL-binding motifs in the 2 kb OsGH3.8 promoter. Green bars indicate the positions of the GTAC motifs at 1022 bp (site 1), 1932 bp, and 1936 bp motifs (site 2). The regions amplified by the correspondingly named primers (see the Materials and methods) at sites 1 and 2 are indicated by arrows. (D) Yeast one-hybrid analysis of the OsSPL2, OsSPL7, and OsSPL13 proteins binding to the 1022 bp motif. (E) ChIP analysis of SPL7Flag binding to sites 1 and 2 (n=3). (F) Image of the dual-LUC assay. (G) The LUC/REN ratio in the dual-LUC assay indicating relative luciferase activity. The empty vector pHB::GFP was used as control. Values are given as the mean±SD (n=3). The asterisks in (A), (B), (E), and (G) represent a significant difference, as determined by a Student’s t-test at *P<0.05 and **P<0.01, respectively.

