
Fig. 2.
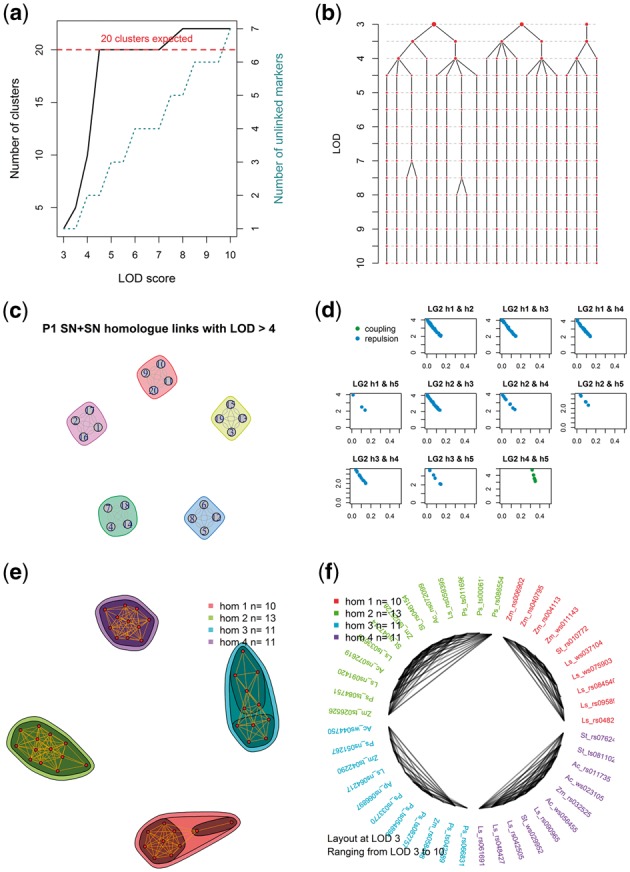
Example visualizations produced by polymapR to facilitate linkage group identification and marker clustering. (a) As LOD score is increased, the number of 1 × 0 clusters increases, as does the number of single-marker clusters (unlinked markers). For a given ploidy and chromosome base number, the expected number of (homologue) clusters is also shown; (b) Alternative representation of (a) which shows the splitting of each cluster as the LOD score is increased. In this example, five chromosomal clusters are identified at LOD 3.5, which split into four homologue clusters between LOD 4.5 and 7; (c) Using linkage to other marker segregation types such as 2 × 0 markers, homologue clusters can be associated into chromosomal clusters, if this was not achieved using 1 × 0 data alone. Here, five chromosomes are represented; (d) If homologues fragment, cross-homologue phase information can help determine which fragments to merge. Here, homologues 4 and 5 show only coupling-phase linkage and should therefore be joined as a single homologue; (e) Alternative approach to merge fragments showing network of linkages over a range of LOD scores. Here, four homologues were successfully identified and merged directly; (f) Alternative representation of (e), showing these connections in a circular format instead