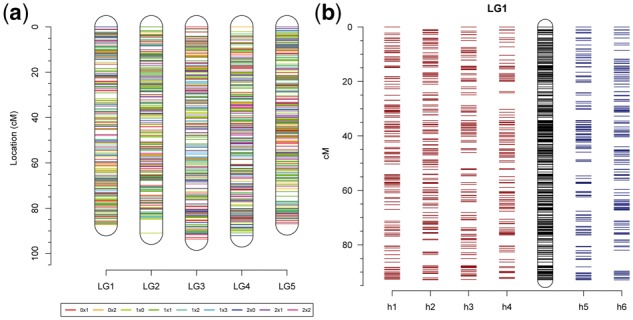
Fig. 3.

Linkage map visualizations of polymapR. (a) Integrated chromosomal linkage maps generated using the sample tetraploid dataset provided with the package, with each marker segregation type highlighted; (b) Phased homologue-specific maps of a single chromosomal linkage group from a triploid dataset (simulated with PedigreeSim; Voorrips and Maliepaard, 2012). Maternal homologue maps (h1–h4) from the tetraploid parent are shown on the left, and paternal homologue maps (h5–h6) from the diploid parent are shown on the right, with the integrated chromosomal map in the middle
