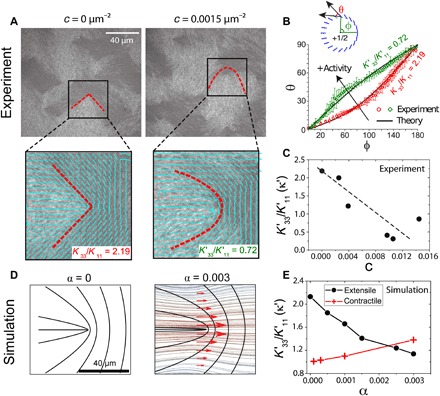
Fig. 2. Effect of activity on defect structure and effective elasticity.

(A) Fluorescence actin images of a passive (c = 0 μm−2) and active (c = 0.0015 μm−2) LC (l = 2 μm). The region enclosed by the box is enlarged below, and the director field (cyan lines) and defect morphology (red dashed lines) are indicated. The ratio of bend (K33) to splay (K11) elasticity calculated from the defect morphology are indicated in the bottom right. (B) Plot of θ versus φ corresponding to experimental images of (A) for the passive (red circles) and active (green diamonds) LC. (C) Apparent elasticity as a function of c for experimental data. Dashed line highlights the linear scaling. (D) Director field from the simulation for both passive (α = 0) and active (α = 0.003) LC. Red arrows around the defect represent the shear flow caused by the velocity field shown in the background. (E) Apparent elasticity κ′ as a function of α obtained from simulations for extensile (black circles) and contractile (red crosses) stresses.
