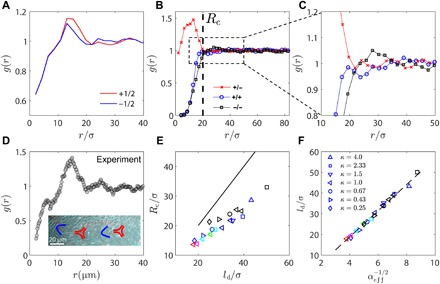
Fig. 5. Radial distribution function of defect structure.

(A) Radial distribution function g(r) for +1/2 and −1/2 defects from simulations for ζ = 0.03 and κ = 1.0. (B) g(r) of defects of specific charge (+1/2 and −1/2) from simulation. (C) Zoom-in of (B) reveals higher-order peaks in g(r). (D) Radial distribution function g(r) of topological defects from experiments with activity c = 0.005 μm−2. Inset shows experimental evidence of higher-order peaks in g(r). (E) A characteristic length scale Rc emerges from g(r) [illustrated in (B)], which is plotted against average defect spacing ld. Black line corresponds to Rc = ld. Warmer color of a marker indicates a higher activity. (F) Average defect spacing ld is plotted against , where the effective activity is defined as .
