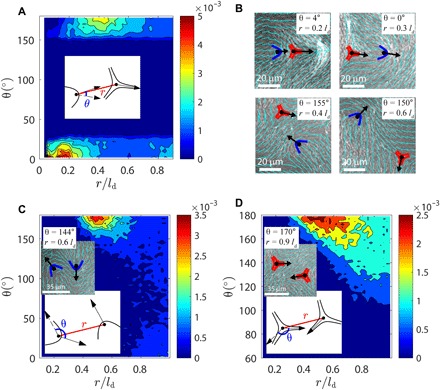
Fig. 6. Analysis of defect orientational structures.

Probability distribution as function of defect distance r and defect angle θ (schematically defined in inset plots) for +/− (A), +/+ (C), and −/− (D) defect pair. Inset images in (C) and (D) show experimental observations of antiparallel like-charge defects (activity level c = 0.005 μm−2 and ld = 44 μm). (B) Typical structures of unlike-charge defect pairs observed in experiments. Top: Defect orientations tend to be parallel at short r. Bottom: Defect orientations tend to be antiparallel at intermediate r.
