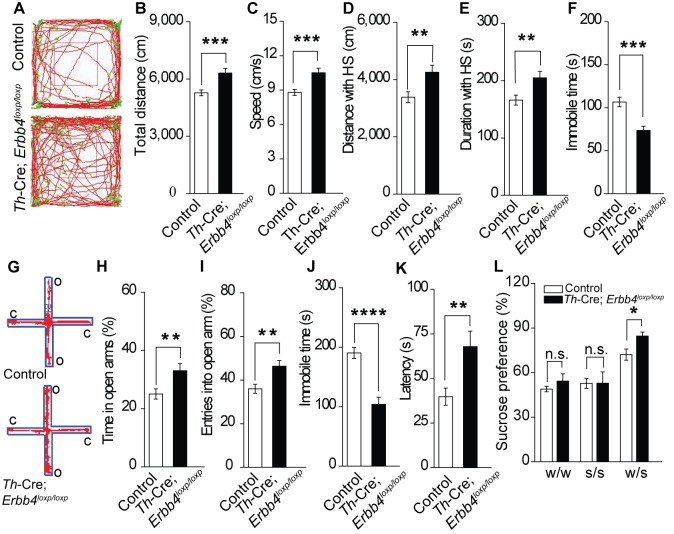
Figure 4. Th-Cre;Erbb4loxp/loxp mice show mania-like behaviors.
(A) Representative trajectories of control (Erbb4loxp/loxp) and Th-Cre;Erbb4loxp/loxp mice. We defined high speed (red line) as >10 cm/s, immobility as <2 cm/s, and low speed (green line) as 2 – 10 cm/s. (B), (C) Locomotor activity (B) and speed (C) of control and Th-Cre;Erbb4loxp/loxp mice in open field tests. n = 24 (control); n = 22 (Th-Cre;Erbb4loxp/loxp). (D), (E) Distance (D) and duration (E) traveled at high speed (HS). n = 17 (control); n = 13 (Th-Cre;Erbb4loxp/loxp). (F) Immobility time during open field tests decreased in Th-Cre;Erbb4loxp/loxp mice. (G) Examples of the performance of control and Th-Cre;Erbb4loxp/loxp mice in the EPM test. C, closed arm; O, open arm. (H), (I) Performance of control and Th-Cre;Erbb4loxp/loxp mice in the EPM test. n = 34 (control); n = 24 (Th-Cre;Erbb4loxp/loxp). (J), (K) Immobility time (J) and latency to first surrender (K) in the forced swim test. n = 22 (control); n = 13 (Th-Cre;Erbb4loxp/loxp). (L) Sucrose preference of control and Th-Cre;Erbb4loxp/loxp mice. Water (w). Sucrose (s). n = 19 (control); n = 14 (Th-Cre;Erbb4loxp/loxp). Unpaired two-tailed Student’s t-test. Data are expressed as means ± s.e.m. *p<0.05, **p<0.01, ***p<0.001, ****p<0.0001. n.s., not significant.
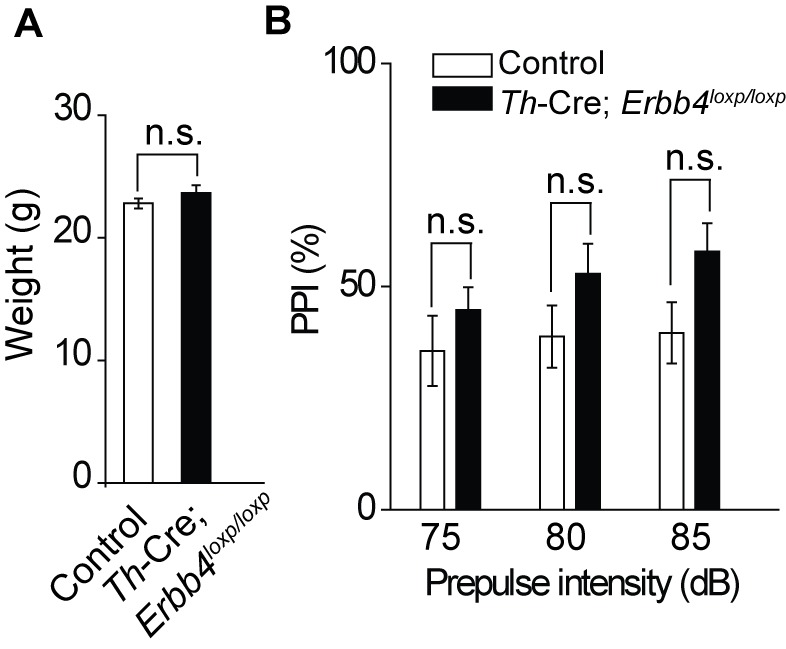
Figure 4—figure supplement 1. There was no significant difference in body weight between control and Th-Cre;Erbb4loxp/loxp mice and no deficit of Th-Cre;Erbb4loxp/loxp mice in the prepulse inhibition experiment.

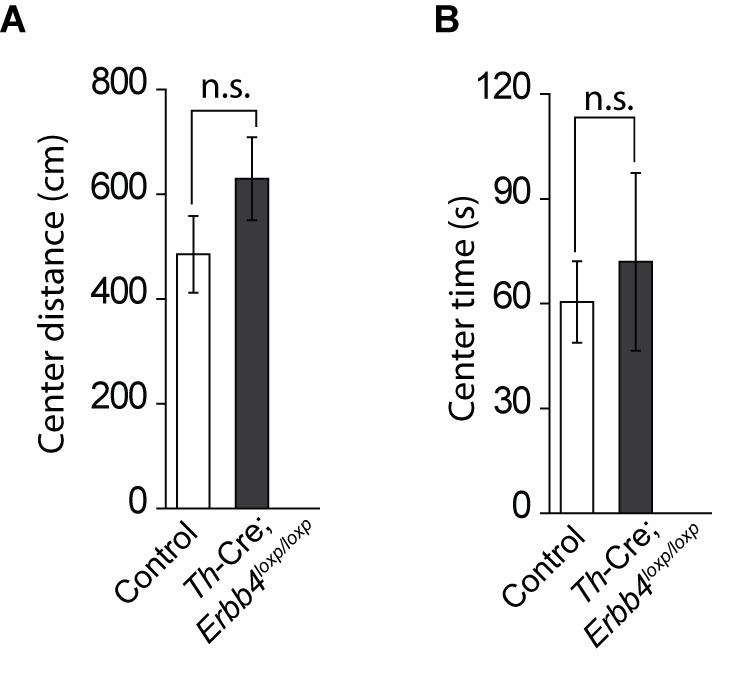
Figure 4—figure supplement 2. No significant change in the distance travelled in center and time spent in center area between control (Erbb4loxp/loxp) mice and Th-Cre; Erbb4loxp/loxp mice in open field test.


