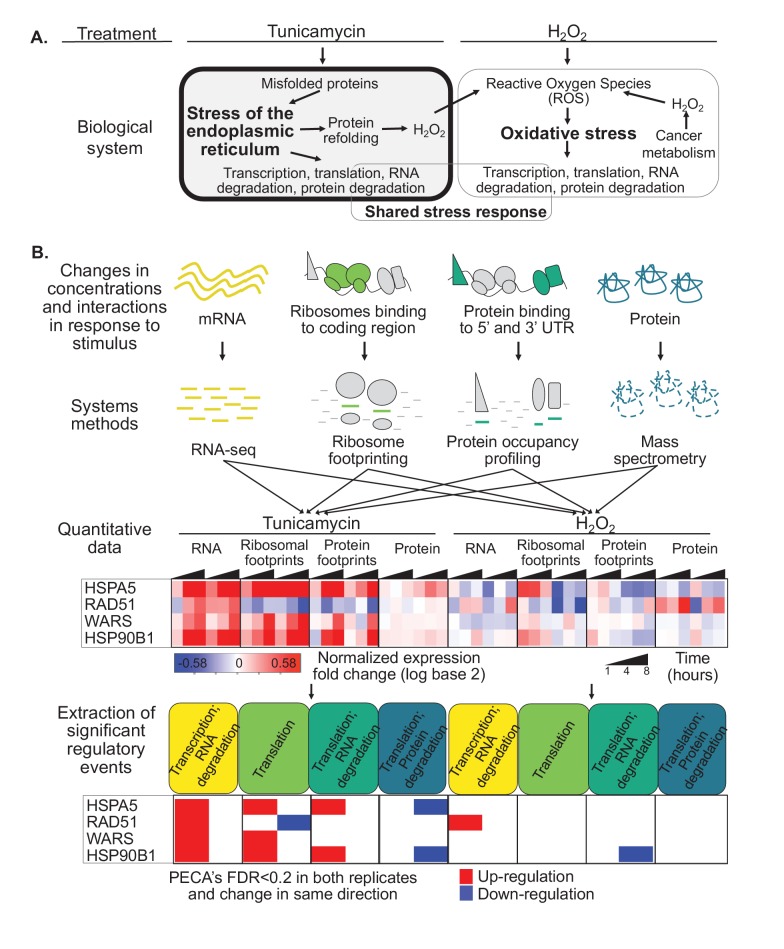
Figure 1. Protein misfolding stress involves multiple processes.
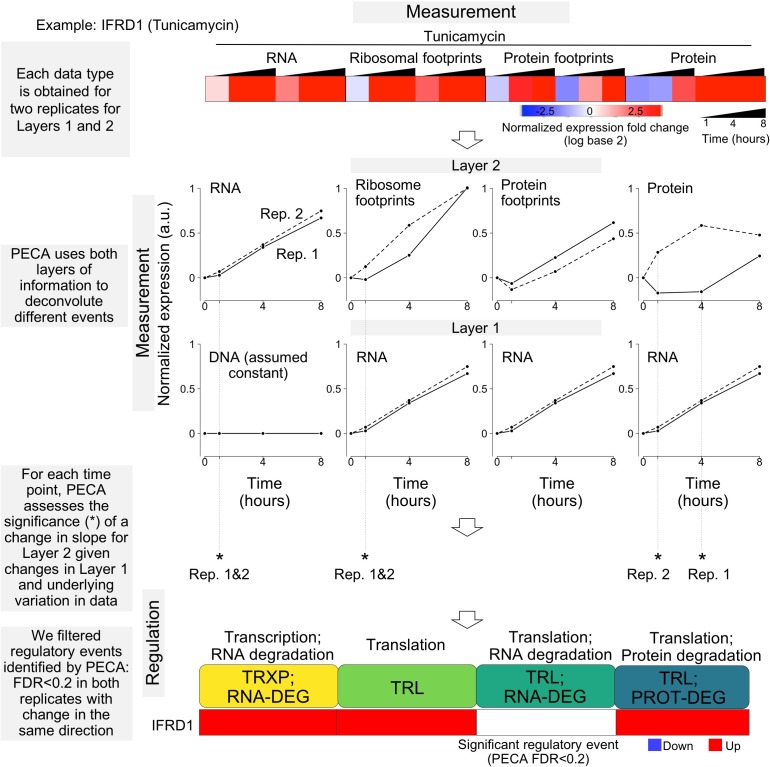
(A) We investigate the multi-layered regulation during the response to protein misfolding stress. The schematic illustrates the simplified relationship between protein misfolding, stress of the endoplasmic reticulum (ER), and oxidative stress. Tunicamycin elicits ER stress, which triggers various downstream effects including transcription, translation, and RNA and protein degradation. Attempts to refold proteins increases production of hydrogen peroxide in the cell. Hydrogen peroxide, in turn, elicits oxidative stress through an imbalance of reactive oxygen species (ROS). In cancer cells, basal ROS levels can be heightened due to altered metabolism. (B) Our experiment extracts significant regulatory events for >7,000 genes in response to either tunicamycin or hydrogen peroxide treatment. The experimental design maps multiple layers of regulation in response to stress, with an emphasis on post-transcriptional regulation. RNA and protein abundances were measured using RNA-seq and mass spectrometry, respectively. Ribosome footprinting and protein occupancy profiling were used to map the binding of ribosomes and non-ribosomal proteins along mRNAs, respectively. Time points and genes with significant regulation were extracted from each data type with the PECA tool (Teo et al., 2018; Teo et al., 2014). The heatmap and PECA results show example genes: the stress response genes HSPA5 (GRP78, BiP) and HSP90B1, the DNA repair gene RAD51, and the aminoacyl-tRNA synthetase WARS. FDR - false discovery rate.


