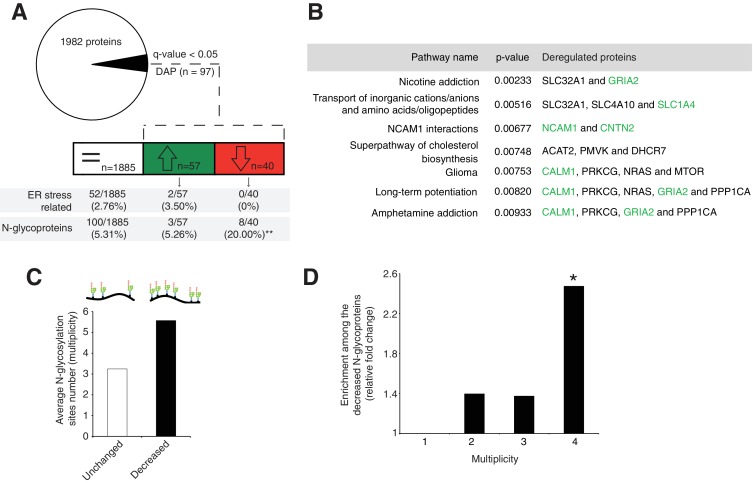
Figure 3. Disrupted neural pathways in the Srd5a3 mutant developing cerebellum.
(A, upper panel) Pie chart representing the total proteomics analysis in P7 cerebellum (n = 4 for each genotype). 97 proteins were detected as differentially abundant proteins (DAP) in the mutant samples (q-value <0.05). (A, lower panel) Distribution of unchanged proteins (white box), increased DAP (green box) and decreased DAP (red box) into ER stress-related (GO:0034976) or N-glycoproteins (Reference glycoproteomic database, see Materials andmethod) categories. A significant enrichment was detected within the decreased DAP for N-glycoproteins (n = 8, Fisher exact test, p-value=0.0012). (B) Over-representation analysis on DAP performed with ConsensusPathDB using the 1982 detected proteins as background. All pathways with p-value<0.01 are represented. N-glycoproteins are indicated in green. (C) Average multiplicity in the unchanged and the decreased N-glycoproteins groups. (D) Enrichment for different glycoprotein categories among the decreased N-glycoproteins. Multiplicity represents groups of proteins with more than one (≥2), two (≥3) or three (≥4) N-glycosylation sites. Multiplicity of ≥1 represents all of the decreased N-glycoproteins and is set to one (no enrichment). There is a significant 2.4 fold-change enrichment for glycoproteins with four or more N-glycans among the decreased N-glycoproteins (Fischer exact test, p-value=0.0378).


