Figure 1.
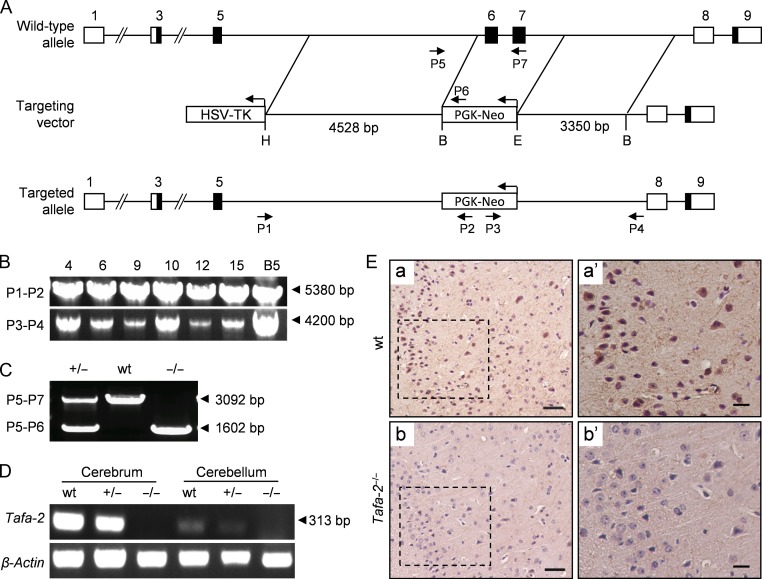
Generation of Tafa-2 knockout mice (A) Graphic representation of the Tafa-2 targeting strategy. Boxes represent exons with the coding region in black. The targeting vector contained 4528 bp of 5′ homology and 3350 bp of 3′ homology. PGK-Neo and HSV-TK were used for positive and negative selection, respectively. P1–P7, primers for genotyping and their relative positions are indicated. H, HindIII; B, BamHI; E, EcoRI. (B) Representative PCR genotyping of the ES cell clones and F1 hybrid generation obtained by crossing male chimeras with C57BL/6J females, using primers P1 and P2 to the 5′ arm and P3 and P4 to the 3′ arm. Products of 5380 bp and 4200 bp were obtained, respectively, and verified by DNA sequencing. (C) Triple primer PCR strategy using primers P5-P7 was designed for routine genotyping. The size of PCR products (arrowhead) was shown on the right of the images. (D) RT-PCR with total RNAs from cerebrum and cerebellum of mice with different Tafa-2 genotypes. Primers amplifying a specific region of the Tafa-2 coding sequence were used. β-Actin was used as an internal control. (E) Immunohistochemistry analysis of cortex sections from wt and Tafa-2−/− mice. Boxed areas in a and b were magnified in a’ and b’. Scale bar = 50 μm in a and b. Scale bar = 20 μm in a′ and b′.

