Figure 5.
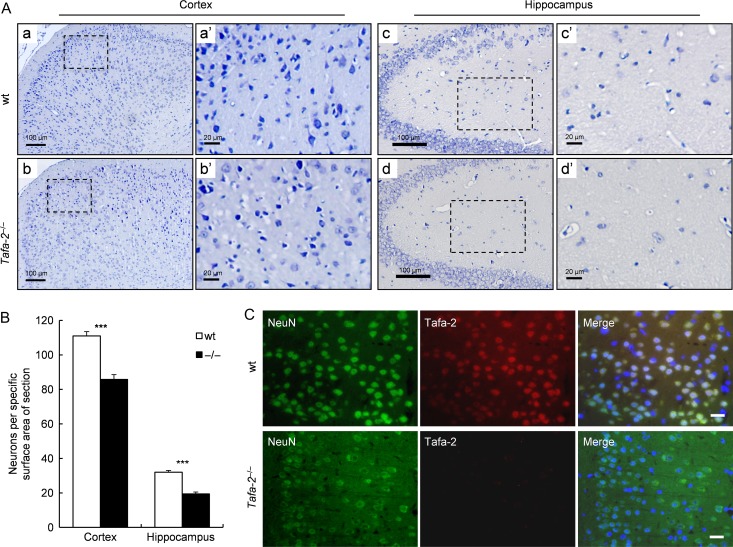
Severe neuronal loss in the brain of Tafa-2−/− mice (A) Representative images of Nissl staining on sections of cortex and hippocampus from wt and Tafa-2−/− mice. Boxed areas in a, b, c, and d were magnified in a′, b′, c′, and d′. Scale bar = 100 μm in a, b, c, and d. Scale bar = 20 μm in a′, b′, c′, and d′. (B) The number of Nissl positive neurons per specific surface area (around 220 μm × 164 μm) of section from cortex and hippocampus was quantified by image analysis using Image-Pro Plus software and compared between wt and Tafa-2−/− mice. The data were average results of 12 sections from four mice each group (three sections per mouse). Data are shown as the mean ± SE. Student’s t test: ***P < 0.001. (C) Representative images of immunofluorescence of NeuN, a neuron marker, and Tafa-2 on sections of cortex from wt and Tafa-2−/− mice. Scale bar = 20 μm.

