Figure 6.
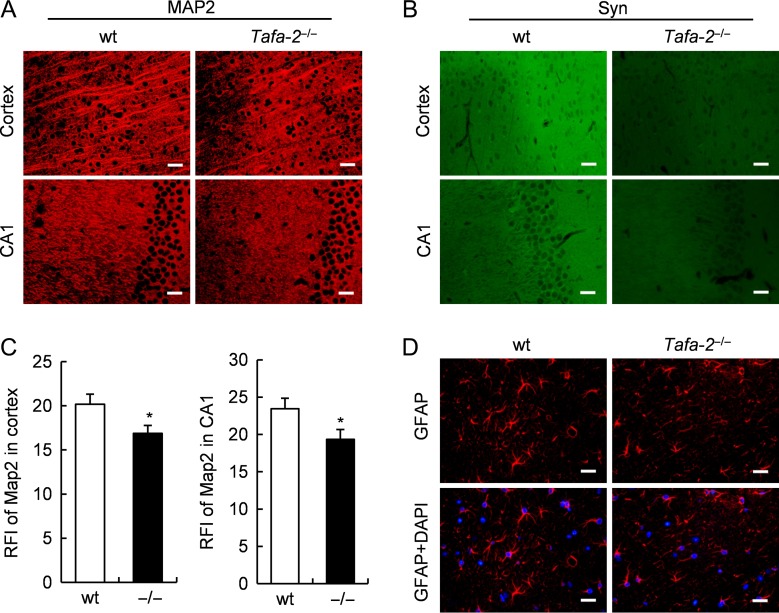
Defects in dendritic and synaptic morphology in the brain of Tafa2−/− mice (A) Immunofluorescence of MAP2, on sections of cortex and hippocampal CA1 area of wt and Tafa-2−/− mice. Scale bar = 20 μm. (B) Immunofluorescence of synaptophysin (Syn), on sections of cortex and hippocampal CA1 area of wt and Tafa-2−/− mice. Scale bar = 20 μm. (C) Quantitative analysis of the relative fluorescence intensity (RFI) of MAP2 staining in A. n = 4 for each genotype. Student’s t test: *P < 0.05. (D) Immunofluorescence of GFAP. Nuclei were counterstained by DAPI. Scale bar = 20 μm.

