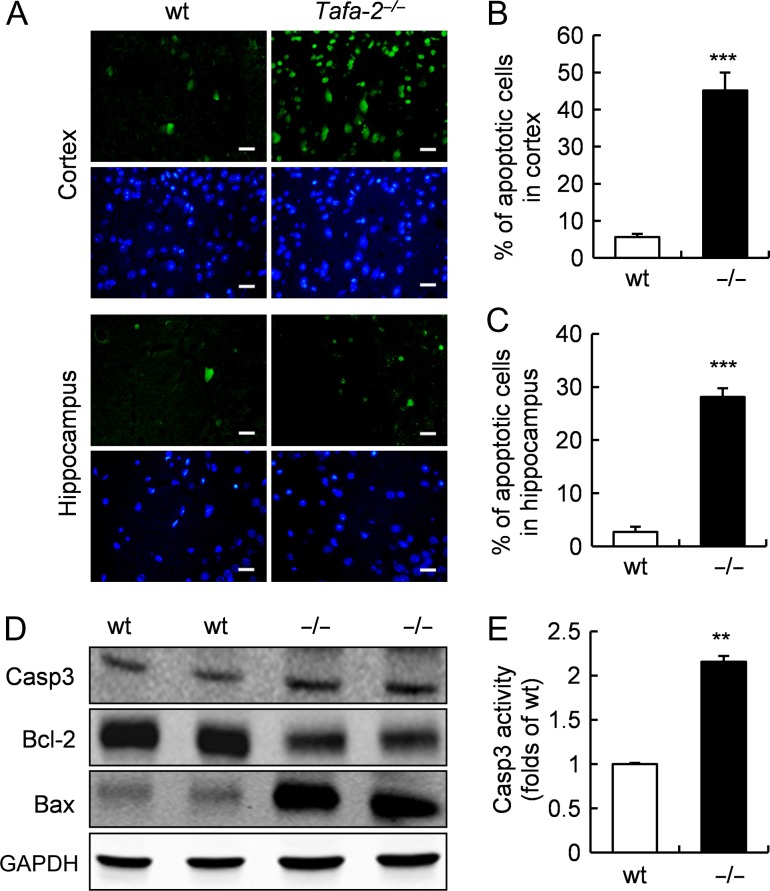
Figure 7.
Increased apoptosis in the brain of Tafa-2−/− mice (A) Representative images of TUNEL staining (green) on sections of cortex and hippocampus from wt and Tafa-2−/− mice. The nuclei were visualized by DAPI counterstain (blue). Scale bar = 20 μm. (B,C) The number of apoptotic cells in cortex and hippocampus was quantified by image analysis and compared between wt and Tafa-2−/− mice. n = 4 for each genotype. Student’s t test: ***P < 0.001. (D) Western blot analysis of caspase-3, Bcl-2 and Bax in the brain lysates of wt and Tafa-2−/− mice. GAPDH was used as a protein loading control. (E) Relative caspase-3 activity in the brain of wt and Tafa-2−/− mice. Data are shown as the mean ± SE. Student’s t test: **P < 0.01, n = 6 for wt and n = 5 for Tafa-2−/− mice.

