FIGURE 2.
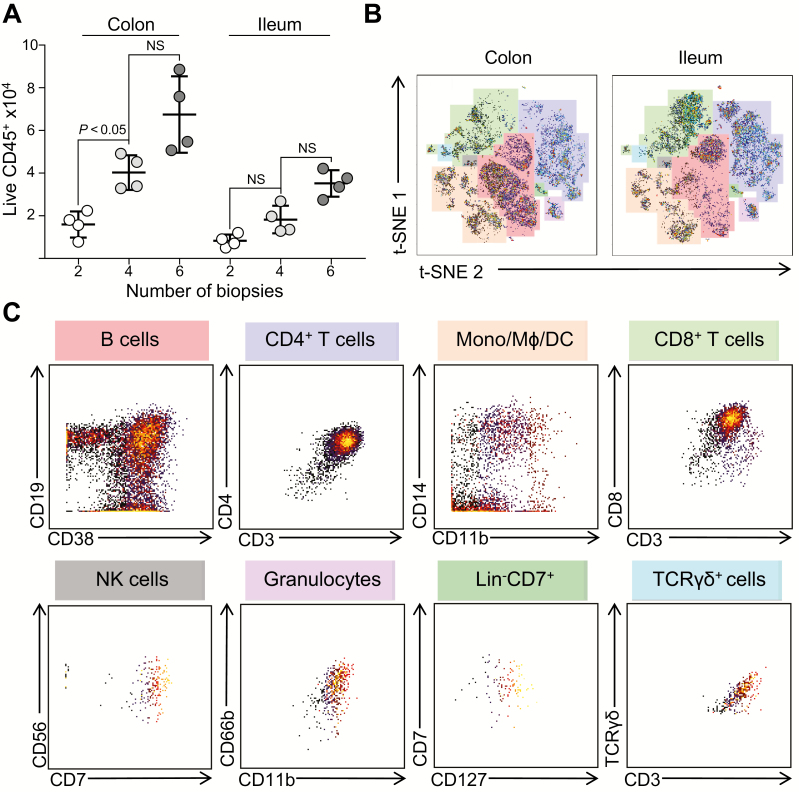
Four to 6 colonic and ileal biopsies are sufficient for robust analyses of immune cell subsets using mass cytometry. A, Yields of live CD45positive events, derived from the indicated number of colon and ileal biopsies, as acquired by CyTOF. Live CD45positive events were identified by gating on nucleated cells, followed by viability staining and CD45 expression. Data points represent paired individual donors, shown as mean ± SD. B, t-SNE analysis of live CD45positive events derived from 4 colonic (left) or ileal (right) biopsies. Color overlays highlight each immune lineage. t-SNE plots display data representative of 4 individual donors. C, Biaxial plots displaying the phenotype of each major population identified by t-SNE analysis in (B). Plots are representative of 4 individual donors.

