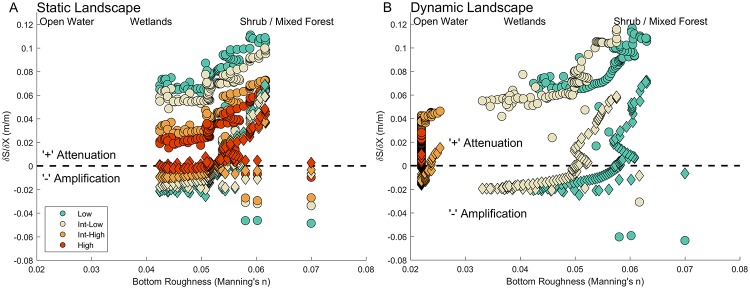
Fig 11. Storm surge attenuation as a function of bottom roughness (via Manning’s n) in Grand Bay for two hurricane events (circles and diamonds) using A) static landscape and B) dynamic landscape (altered bottom roughness and topography/bathymetry).
Negative values indicate storm surge amplification (water level values increasing along the transect–see Fig 2 for location) and positive values indicate storm surge attenuation (water levels reducing along the transect).

