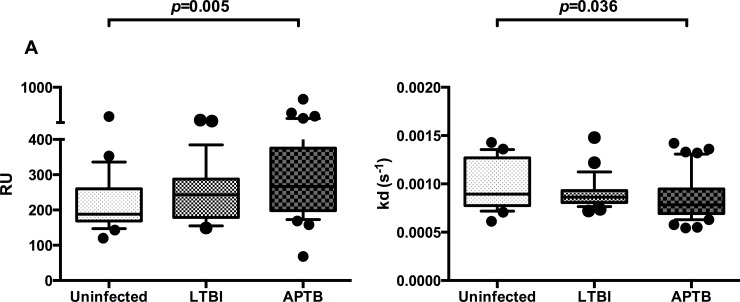
Fig 2. Differences in anti-Ag85A antibody responses and dissociation rates between uninfected controls, individuals with latent TB infection (LTBI) and active pulmonary TB (APTB) cases.
Panel A: response units (RU), Panel B: dissociation rates [kd(s-1)]. The Wilcoxon rank-sum test was used to compare antibody responses and dissociation rates between uninfected controls (n = 23), individuals with LTBI (n = 25) and APTB cases (n = 40). Whiskers represent the 10th and 90th percentile and dots represents samples outside the interquartile range. After correction for multiple testing using the Bonferroni approach, only P values ≤ 0.017 were considered statistical significant.

