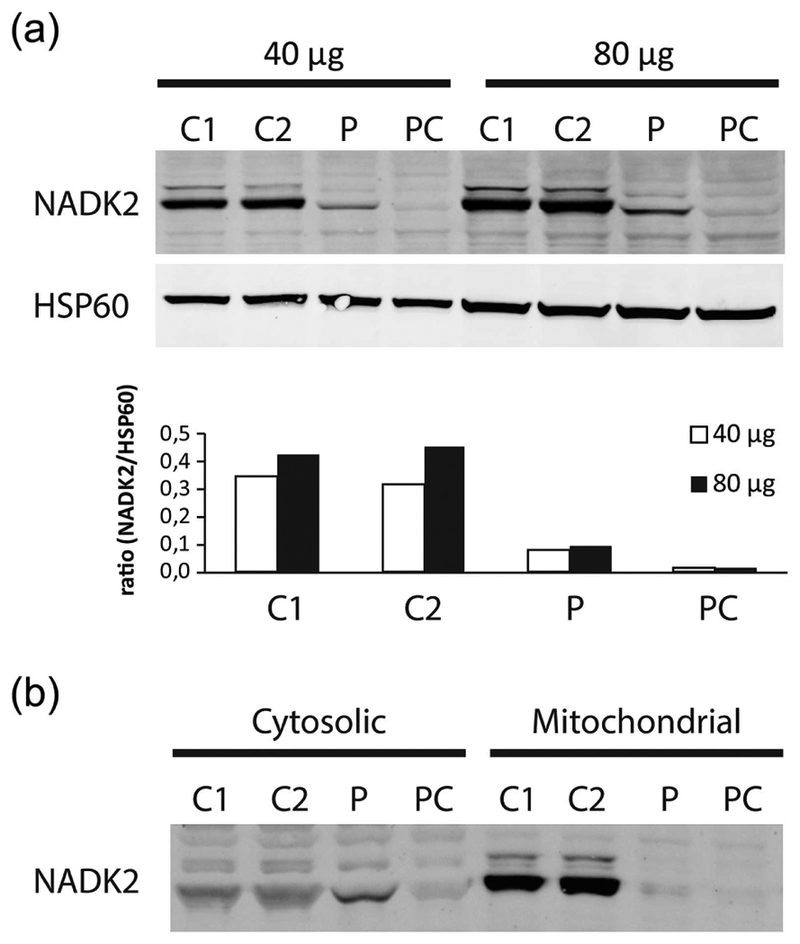
FIGURE 2.

(a) Western blot analysis of fibroblast homogenates of two controls (C1–C2), our patient (P), NADK2D patient control (Houten et al., 2014) (PC) for NADK2 at 40 mg (Left) and 80 mg (Right). Western blot analysis for HSP60 was performed as loading control. (b) NADK2 band for the patient (P) and patient control (PC) appears in the cytosolic fraction rather than, as expected, in the mitochondrial fraction, in contrast to controls (C1–C2)
